Suzieq Analyzer
This document provides a preliminary overview of the features offered by the Suzieq analyzer.
1. Analysis
Let's jump into what you can do with Suzieq now.
We focus on the use of the analyzer via the CLI, suzieq-cli. You launch the CLI inside the docker image. You startup the docker image as described before, via the command:
docker run -itd -v /home/netenglabs/suzieq-data/cloud-native-data-center-networking/parquet-out:/suzieq/parquet --name suzieq netenglabs/suzieq:latest
You then attach to it via docker attach suzieq.
Once inside the Docker container, you can launch the CLI via the command python3 suzieq/cli/suzieq-cli.
There is a command prompt and at the bottom of the screen are some indicators of what Suzieq is up to:
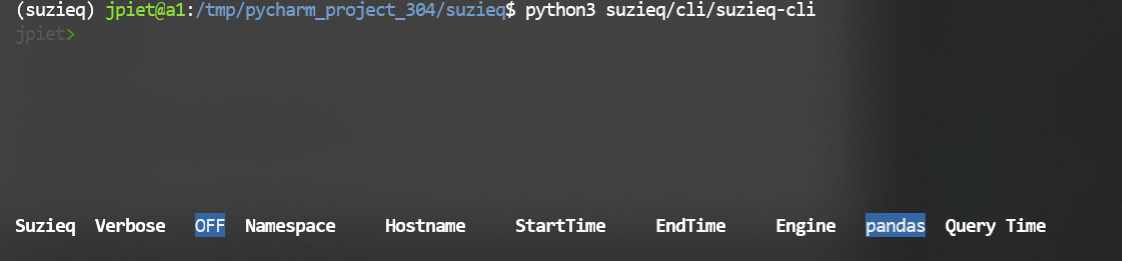 The words at the bottom show specific choices that you can make to filter data.
A important concept in Suzieq is the namespace. we were originally thinking of namespace as datacenter, but it can be whatever grouping of devices that you want. At this point Suzieq cannot build a hierarchy of namespaces. We will add some way to group namespaces together in the future.
To get started, it's often a good idea to look at the help. Just type a '?' to get started:
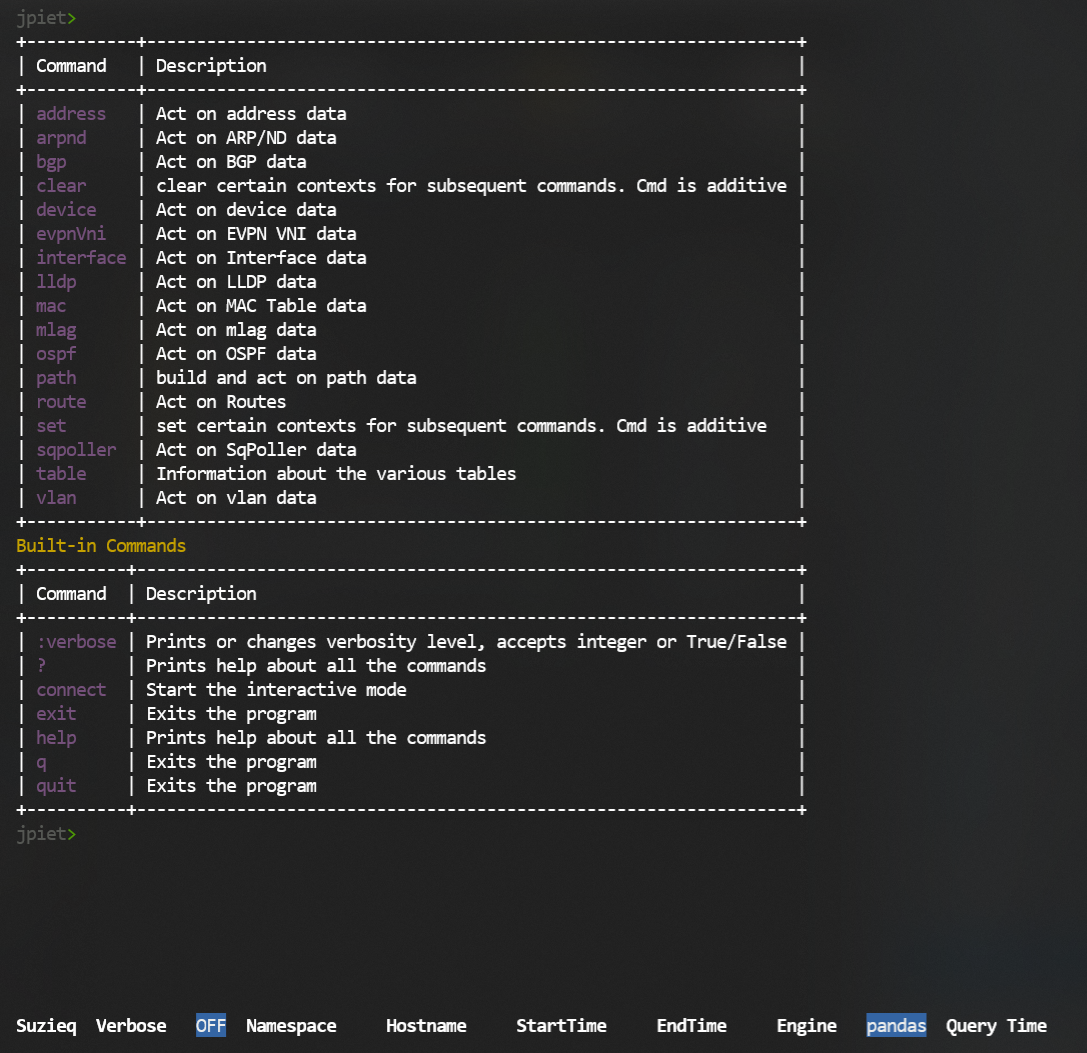 You see the commands that you can use with Suzieq. For each command there are a small number of verbs
and some filters that you can add. Most commands have at least the 'show', 'summary', and 'unique' verbs; some
commands have more.
You see the commands that you can use with Suzieq. For each command there are a small number of verbs
and some filters that you can add. Most commands have at least the 'show', 'summary', and 'unique' verbs; some
commands have more.
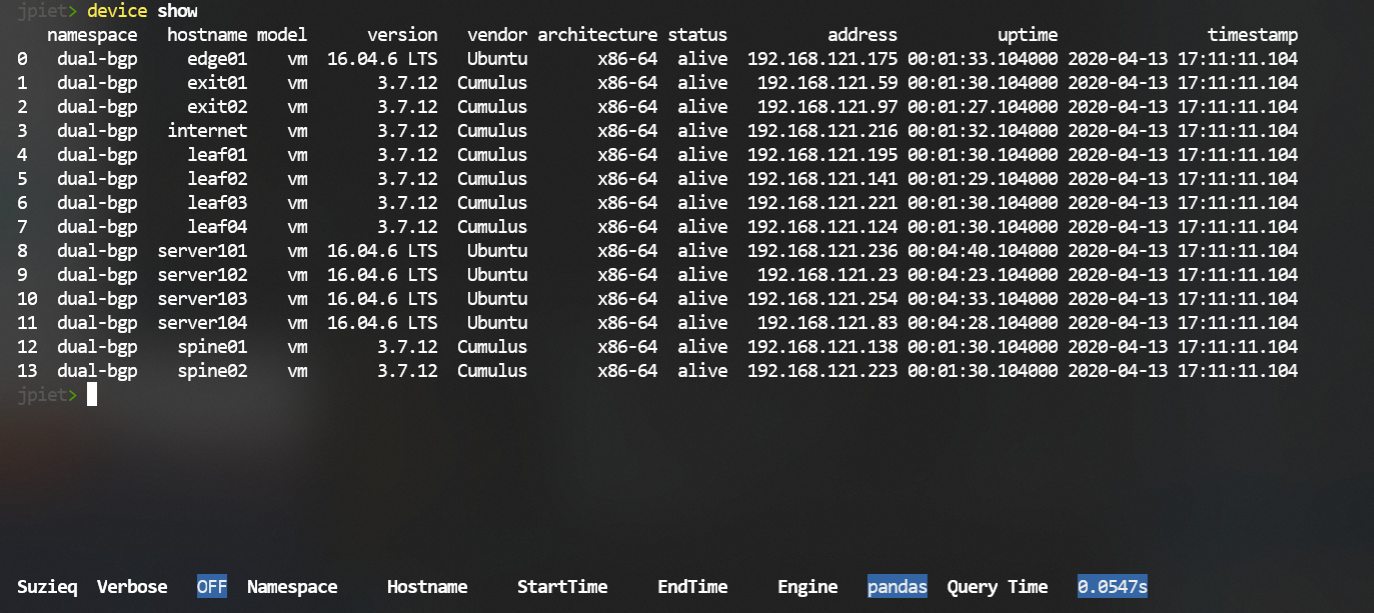
Let's look at some data. We'll start with the system data to get an overview of the devices that we have data for. This shows that we have data from 14 devices and some information about each of the systems. In this case, we have a single namespace, and it has some Cumulus Linux Routers and some Ubuntu hosts.
device show
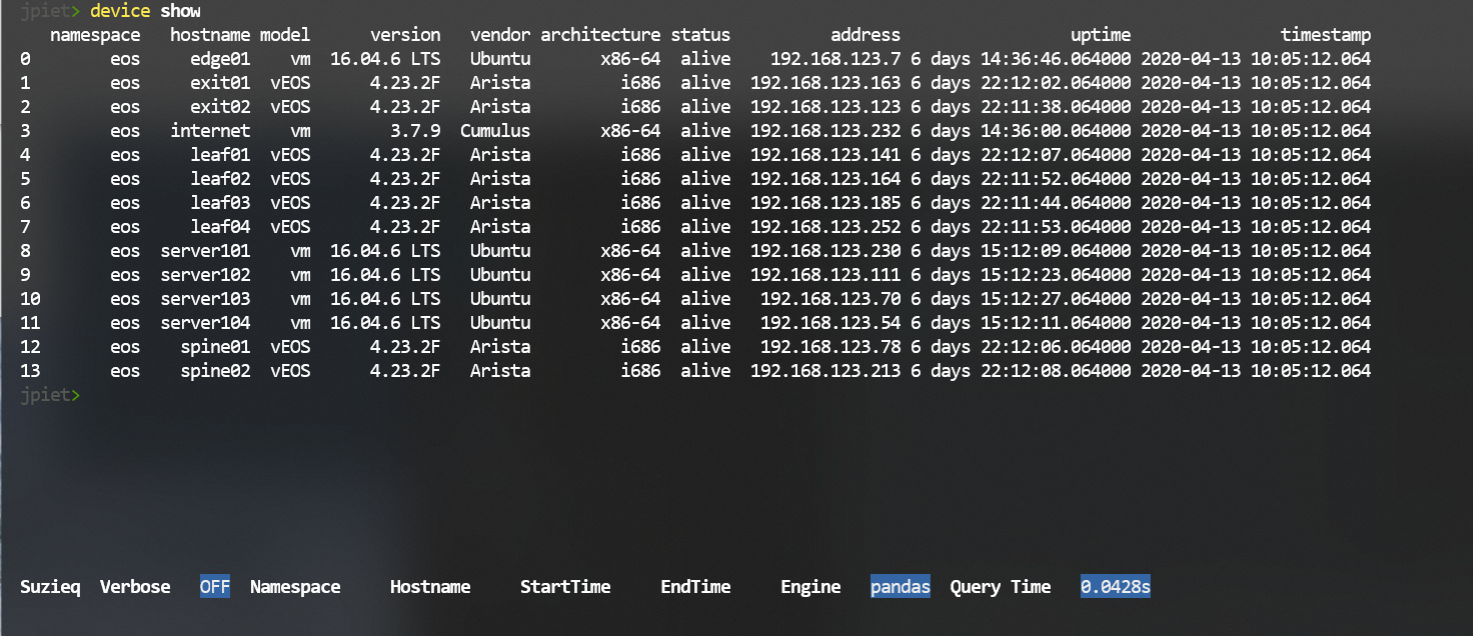
Another example of the same command, with Arista EOS devices. This is also a single namespace, with routers
and hosts.
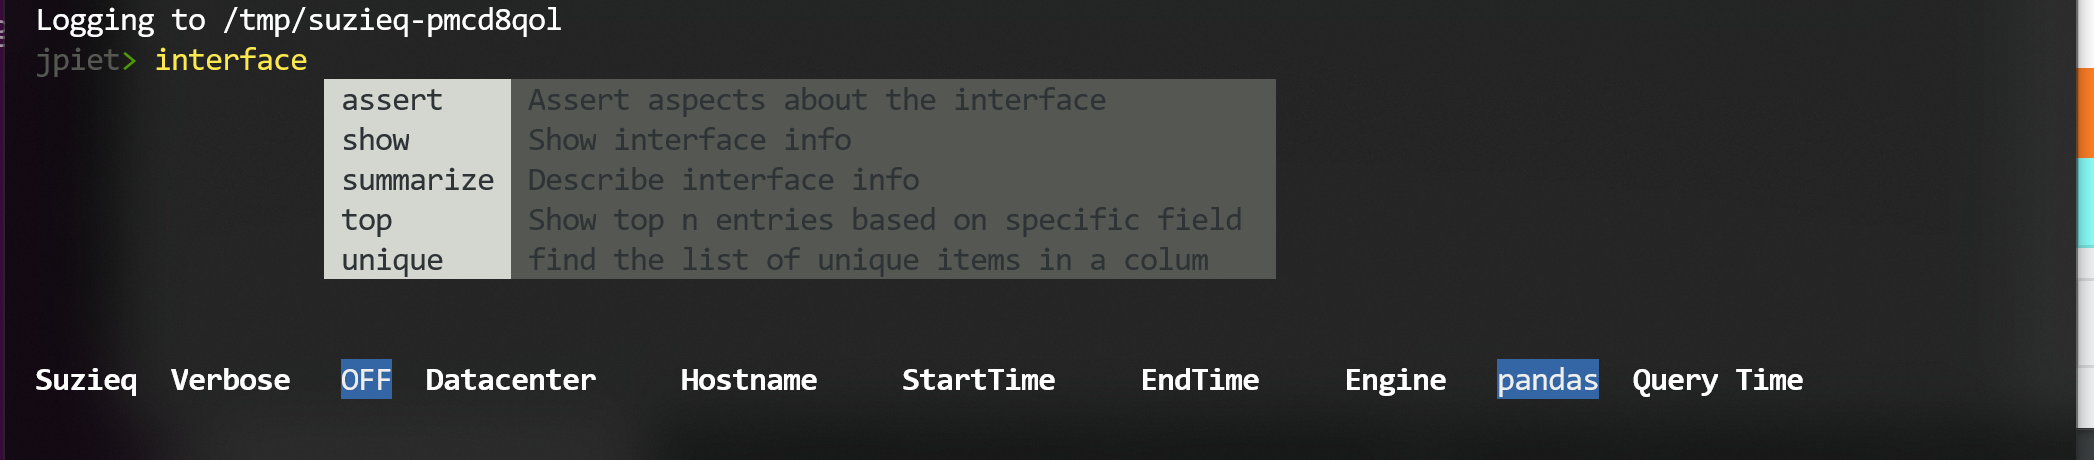
Each command has completion to help you understand what you can do with the command.
For instance, the 'interface' command shows that it has five verbs that you can use with it.
1.1. BGP Analysis Demo
Let's look at BGP data. We'll use this to demonstrate some of the things you can do with Suzieq.
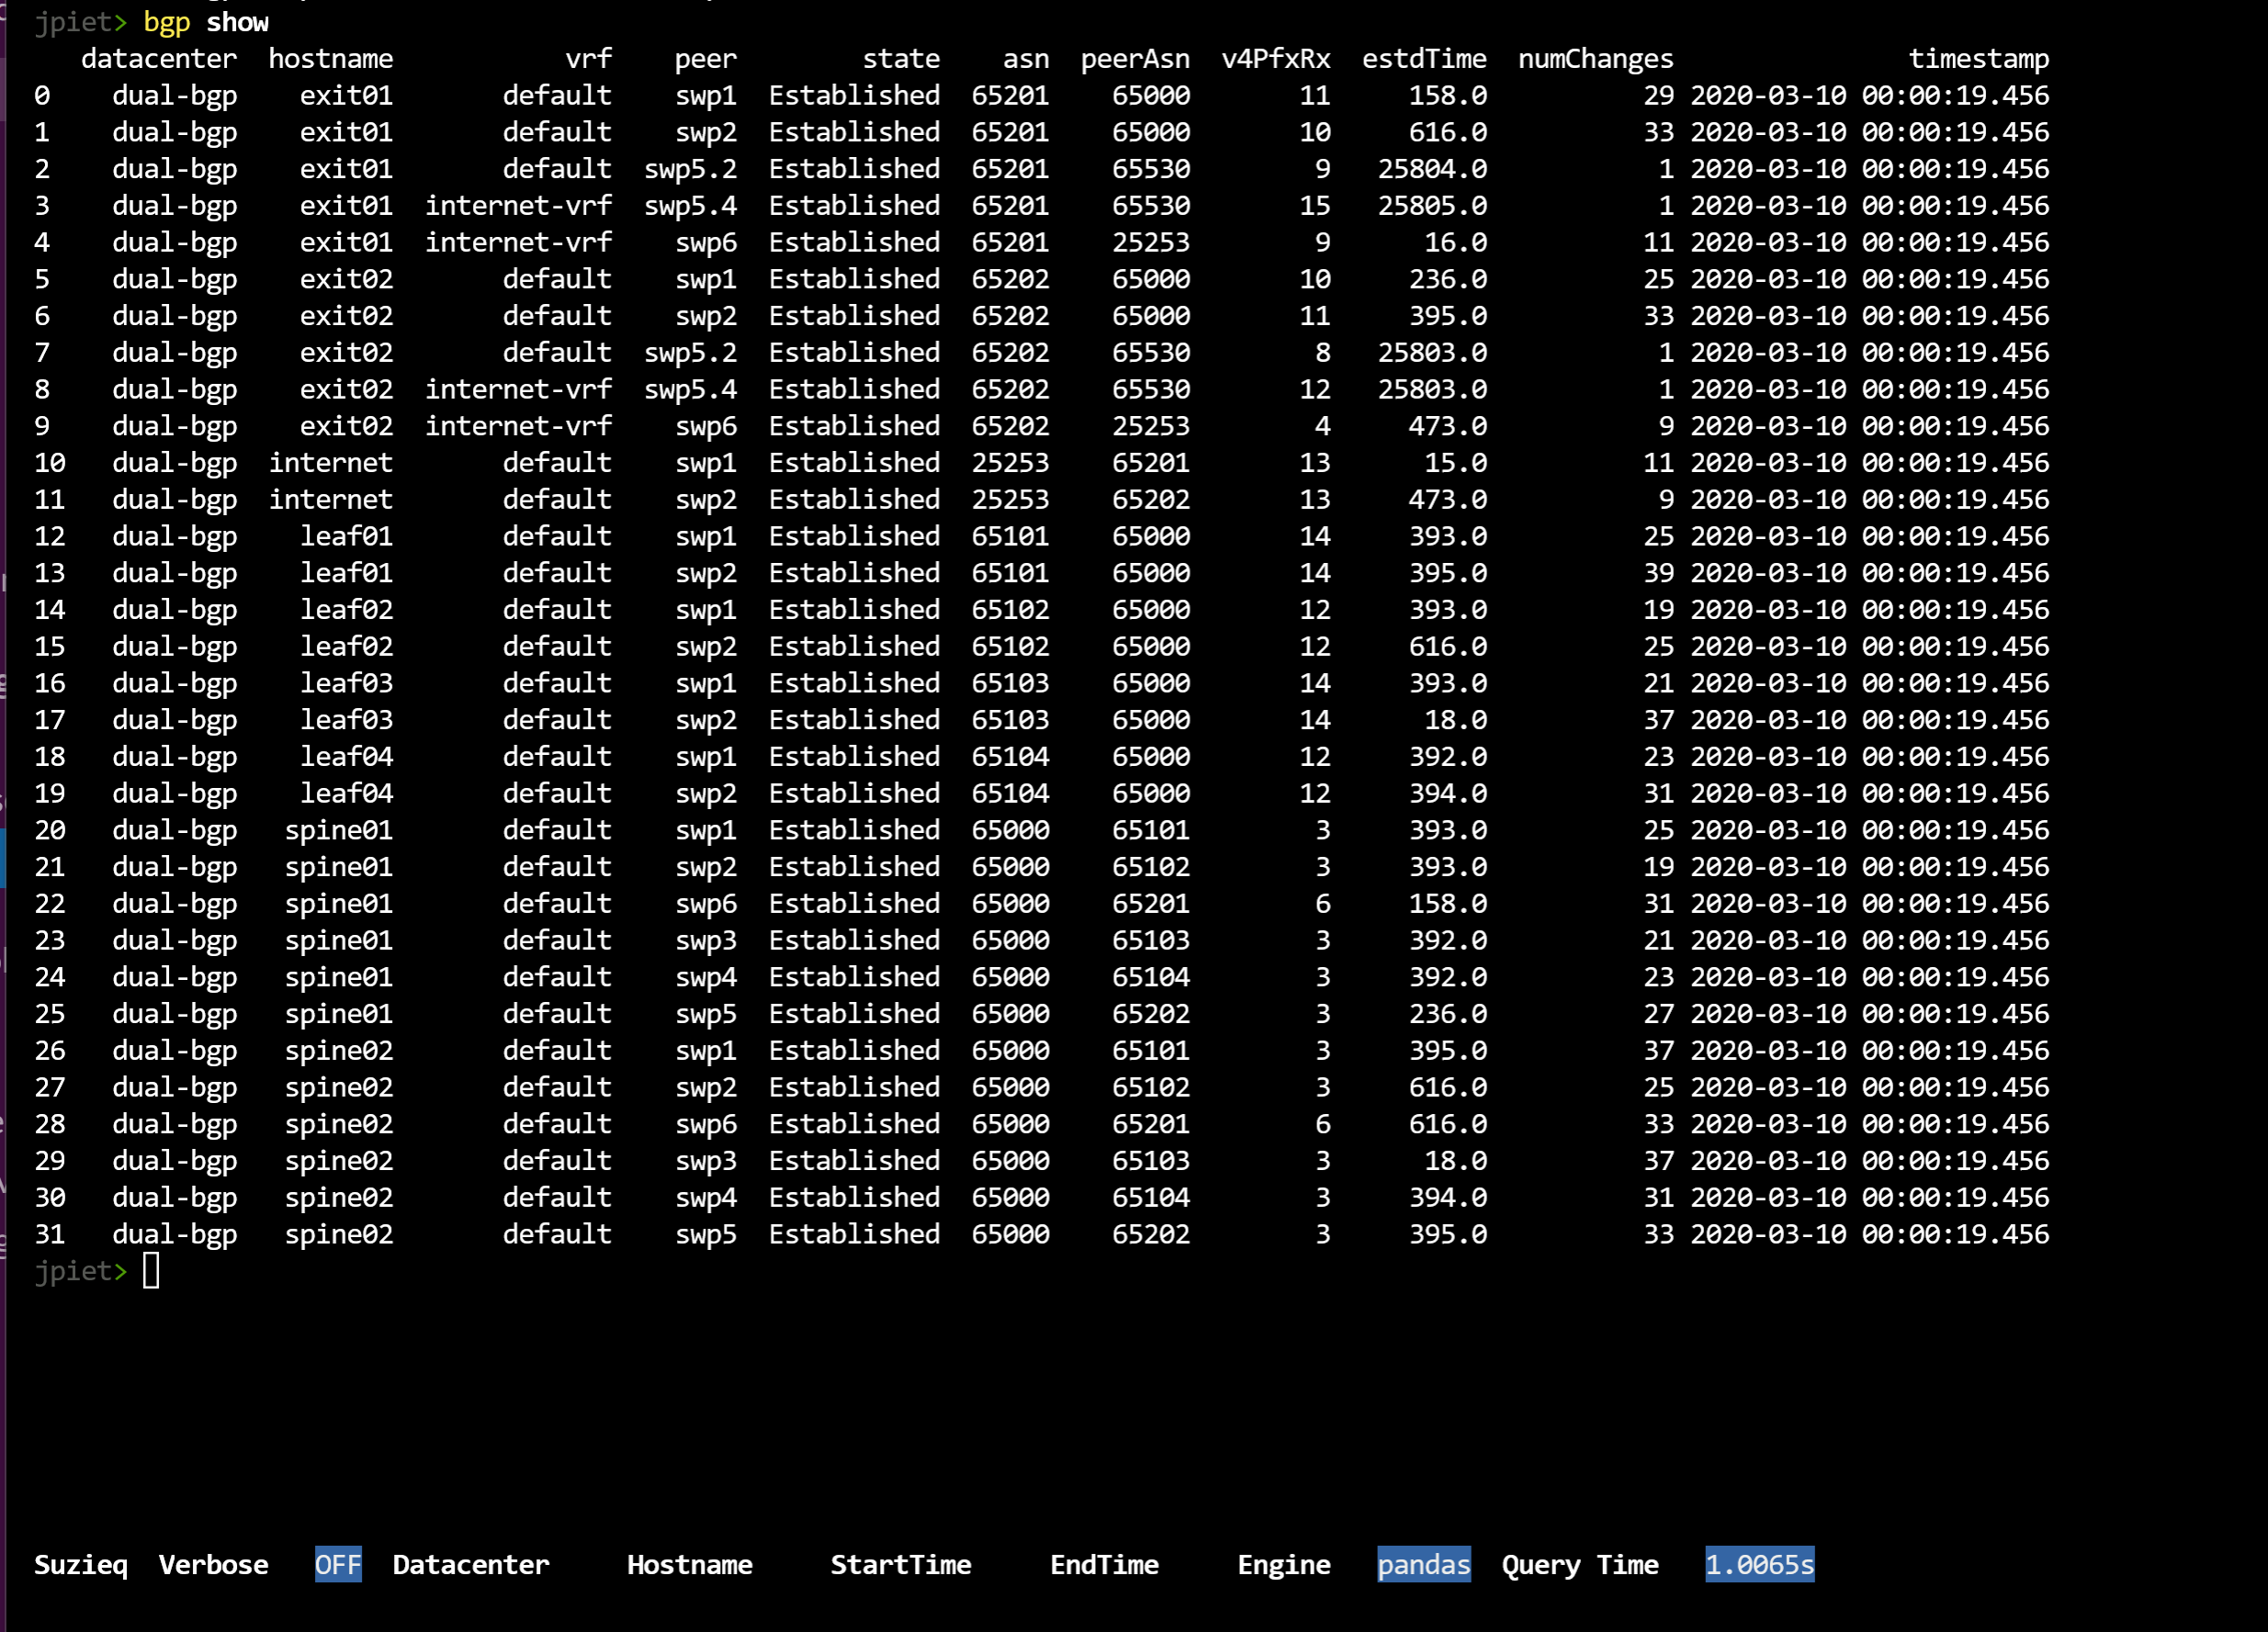
We'll start with 'bgp show'. You can see that Suzieq shows a row per connection of a device and it's peer. This command includes data such as the current state of the connection, asn, peer asn, and important statistics such as the number of prefixes received, how long the connection has been established, and the number of changes in the connection state.
bgp show
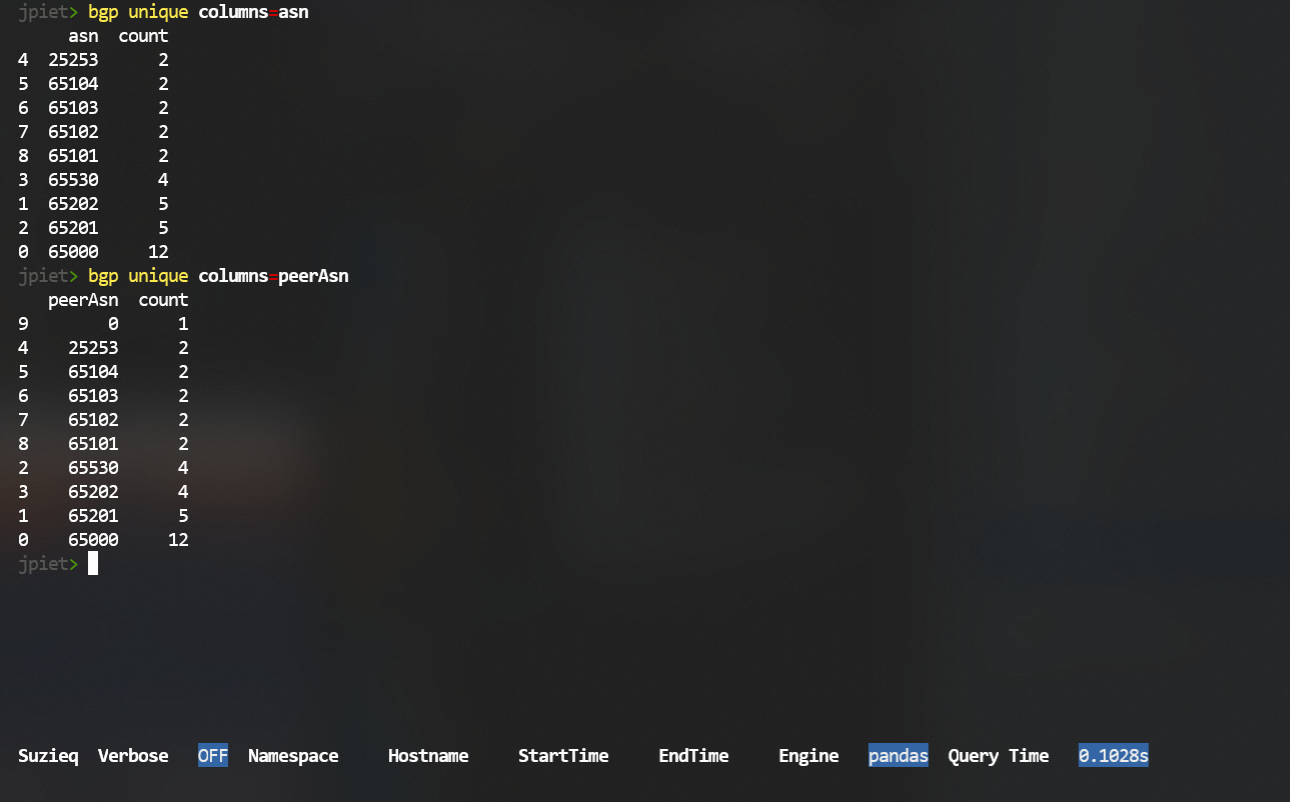
There's a lot of data there. One way to break out data for most commands is to use the 'unique' verb. Unique shows the unique items for a column, and a count of each. In this example, we just want to look at the ASNs. Let's look at what the ASNs are and how many there are of each. The 'unique' command requires that you use a 'columns=' filter to pick which of the columns in the data you want to examine.
bgp unique columns=asn
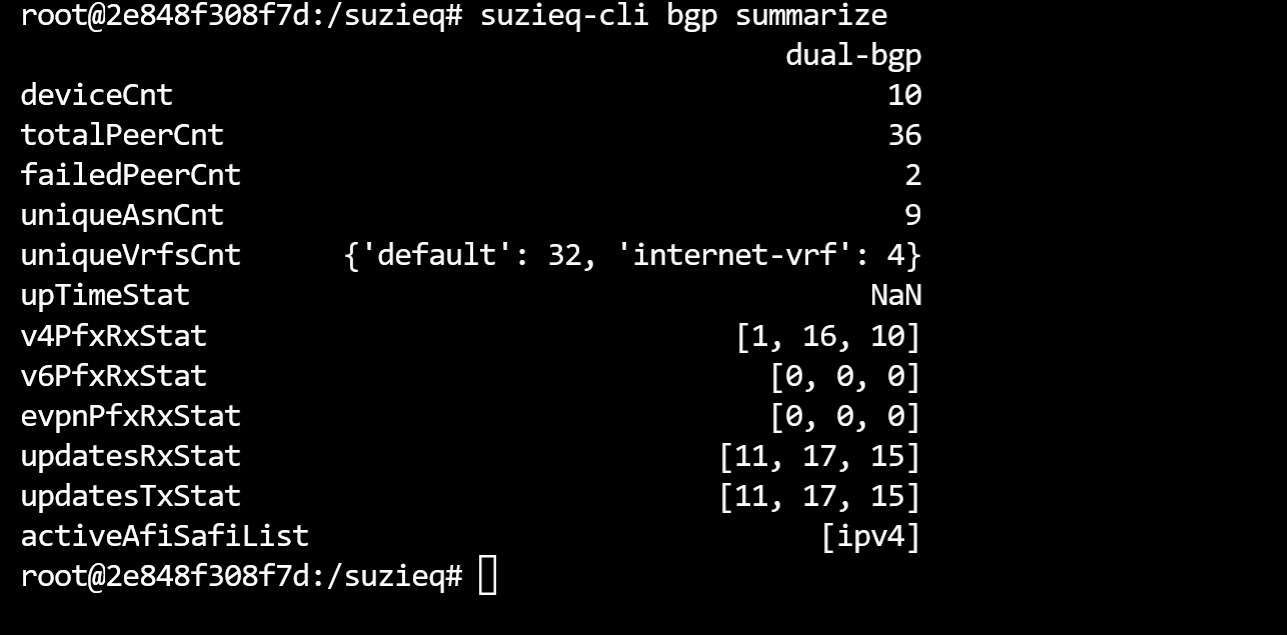
To get an overview of what is going on in a service, Suzieq has the verb 'summarize'. To get an overview of BGP in your networks, Suzieq has the command 'bgp summarize'.
bgp summarize
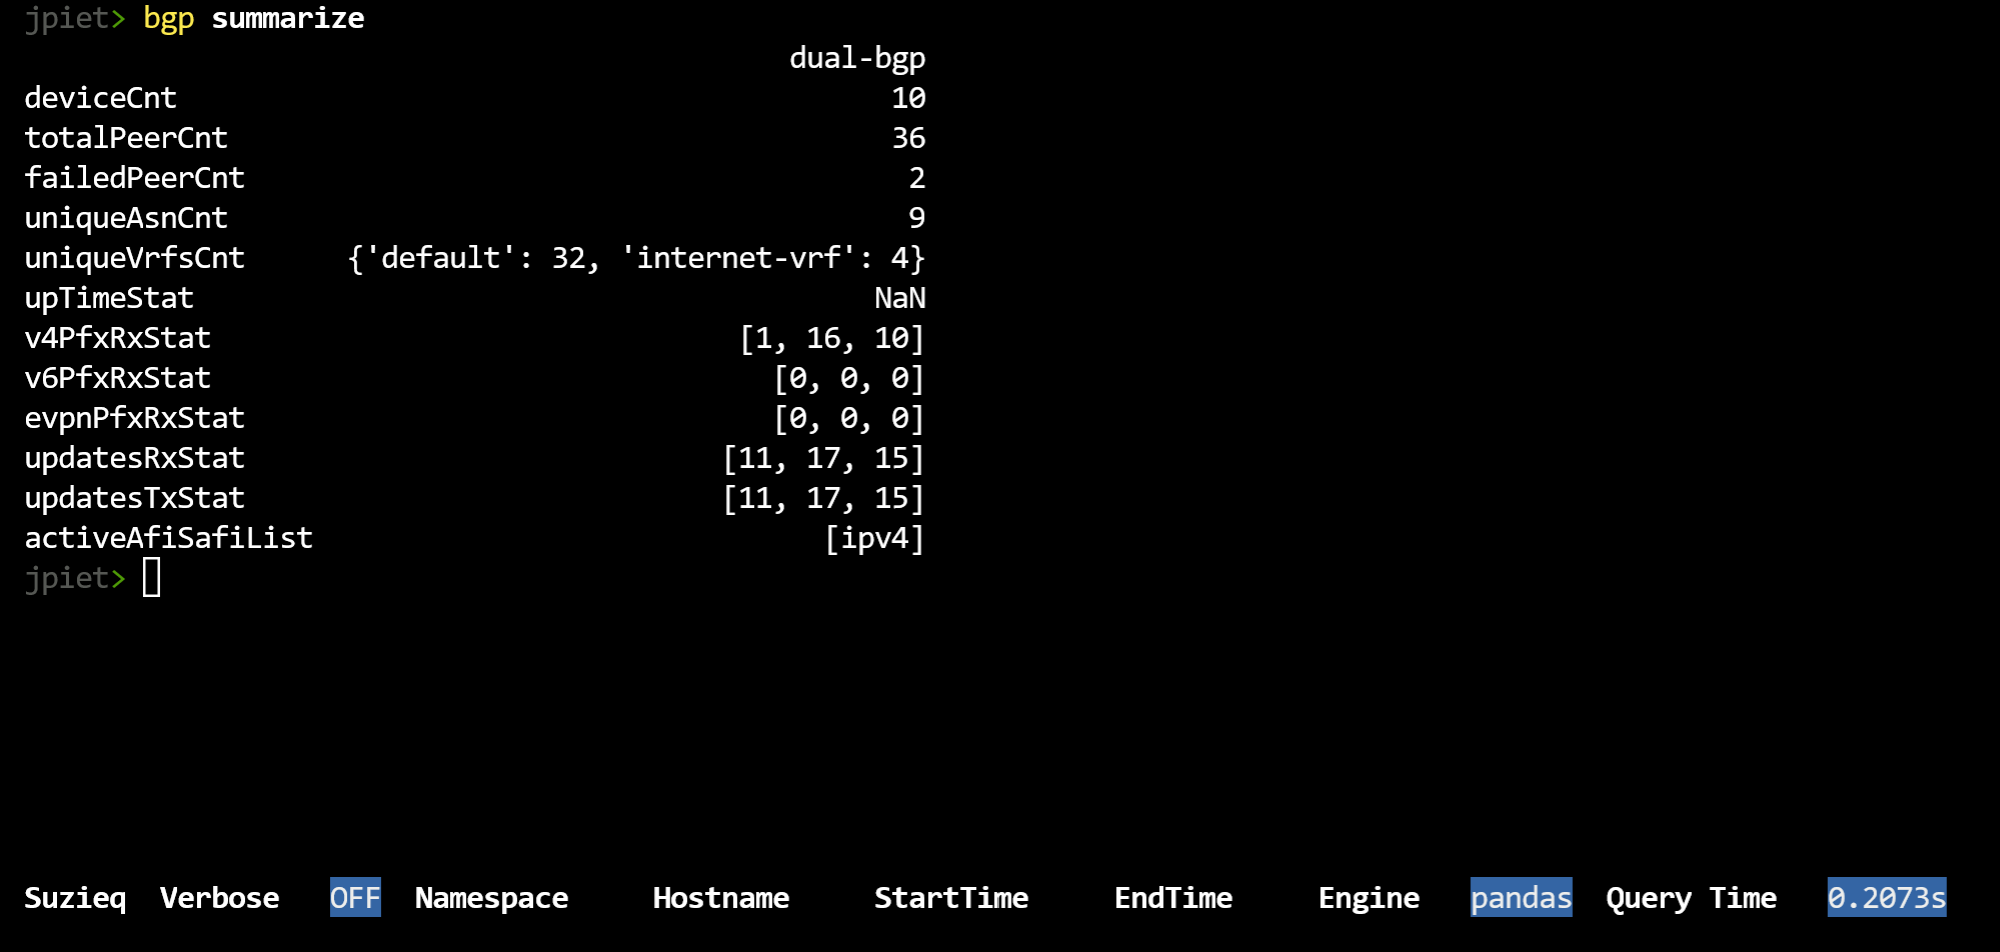 This can be a bit intimidating, as Suzieq is summarizing a lot of information.
As you can see, there is a column per namespace, though in this example we only have one namespace.
We list the number of
ASNs, peerAsns, etc. It shows the number of rows, which are the number of rows in the
table if you had just done a 'bgp show'. For items that have a count of 3 or less,
it shows the entries, and how many there are of each. In this example network,
there are two VRFs, with 'default' having 32 rows and 'internet-vrf' having 4. If an item has has
more than 3 that you'd
like to examine, you can use the 'unique' verb as mentioned above. For instance, from summarize
there are 9 ASNs. Using 'unique', as shown above, you can see each ASN and how many times it is being used.
This can be a bit intimidating, as Suzieq is summarizing a lot of information.
As you can see, there is a column per namespace, though in this example we only have one namespace.
We list the number of
ASNs, peerAsns, etc. It shows the number of rows, which are the number of rows in the
table if you had just done a 'bgp show'. For items that have a count of 3 or less,
it shows the entries, and how many there are of each. In this example network,
there are two VRFs, with 'default' having 32 rows and 'internet-vrf' having 4. If an item has has
more than 3 that you'd
like to examine, you can use the 'unique' verb as mentioned above. For instance, from summarize
there are 9 ASNs. Using 'unique', as shown above, you can see each ASN and how many times it is being used.
Another interesting concept is shown in v4PfxRxStat, v6PfxRxStat, etc, which is if you see three numbers in a list, then Suzieq is showing you min, max, and median. This is our best way to help you understand the distribution that you have.
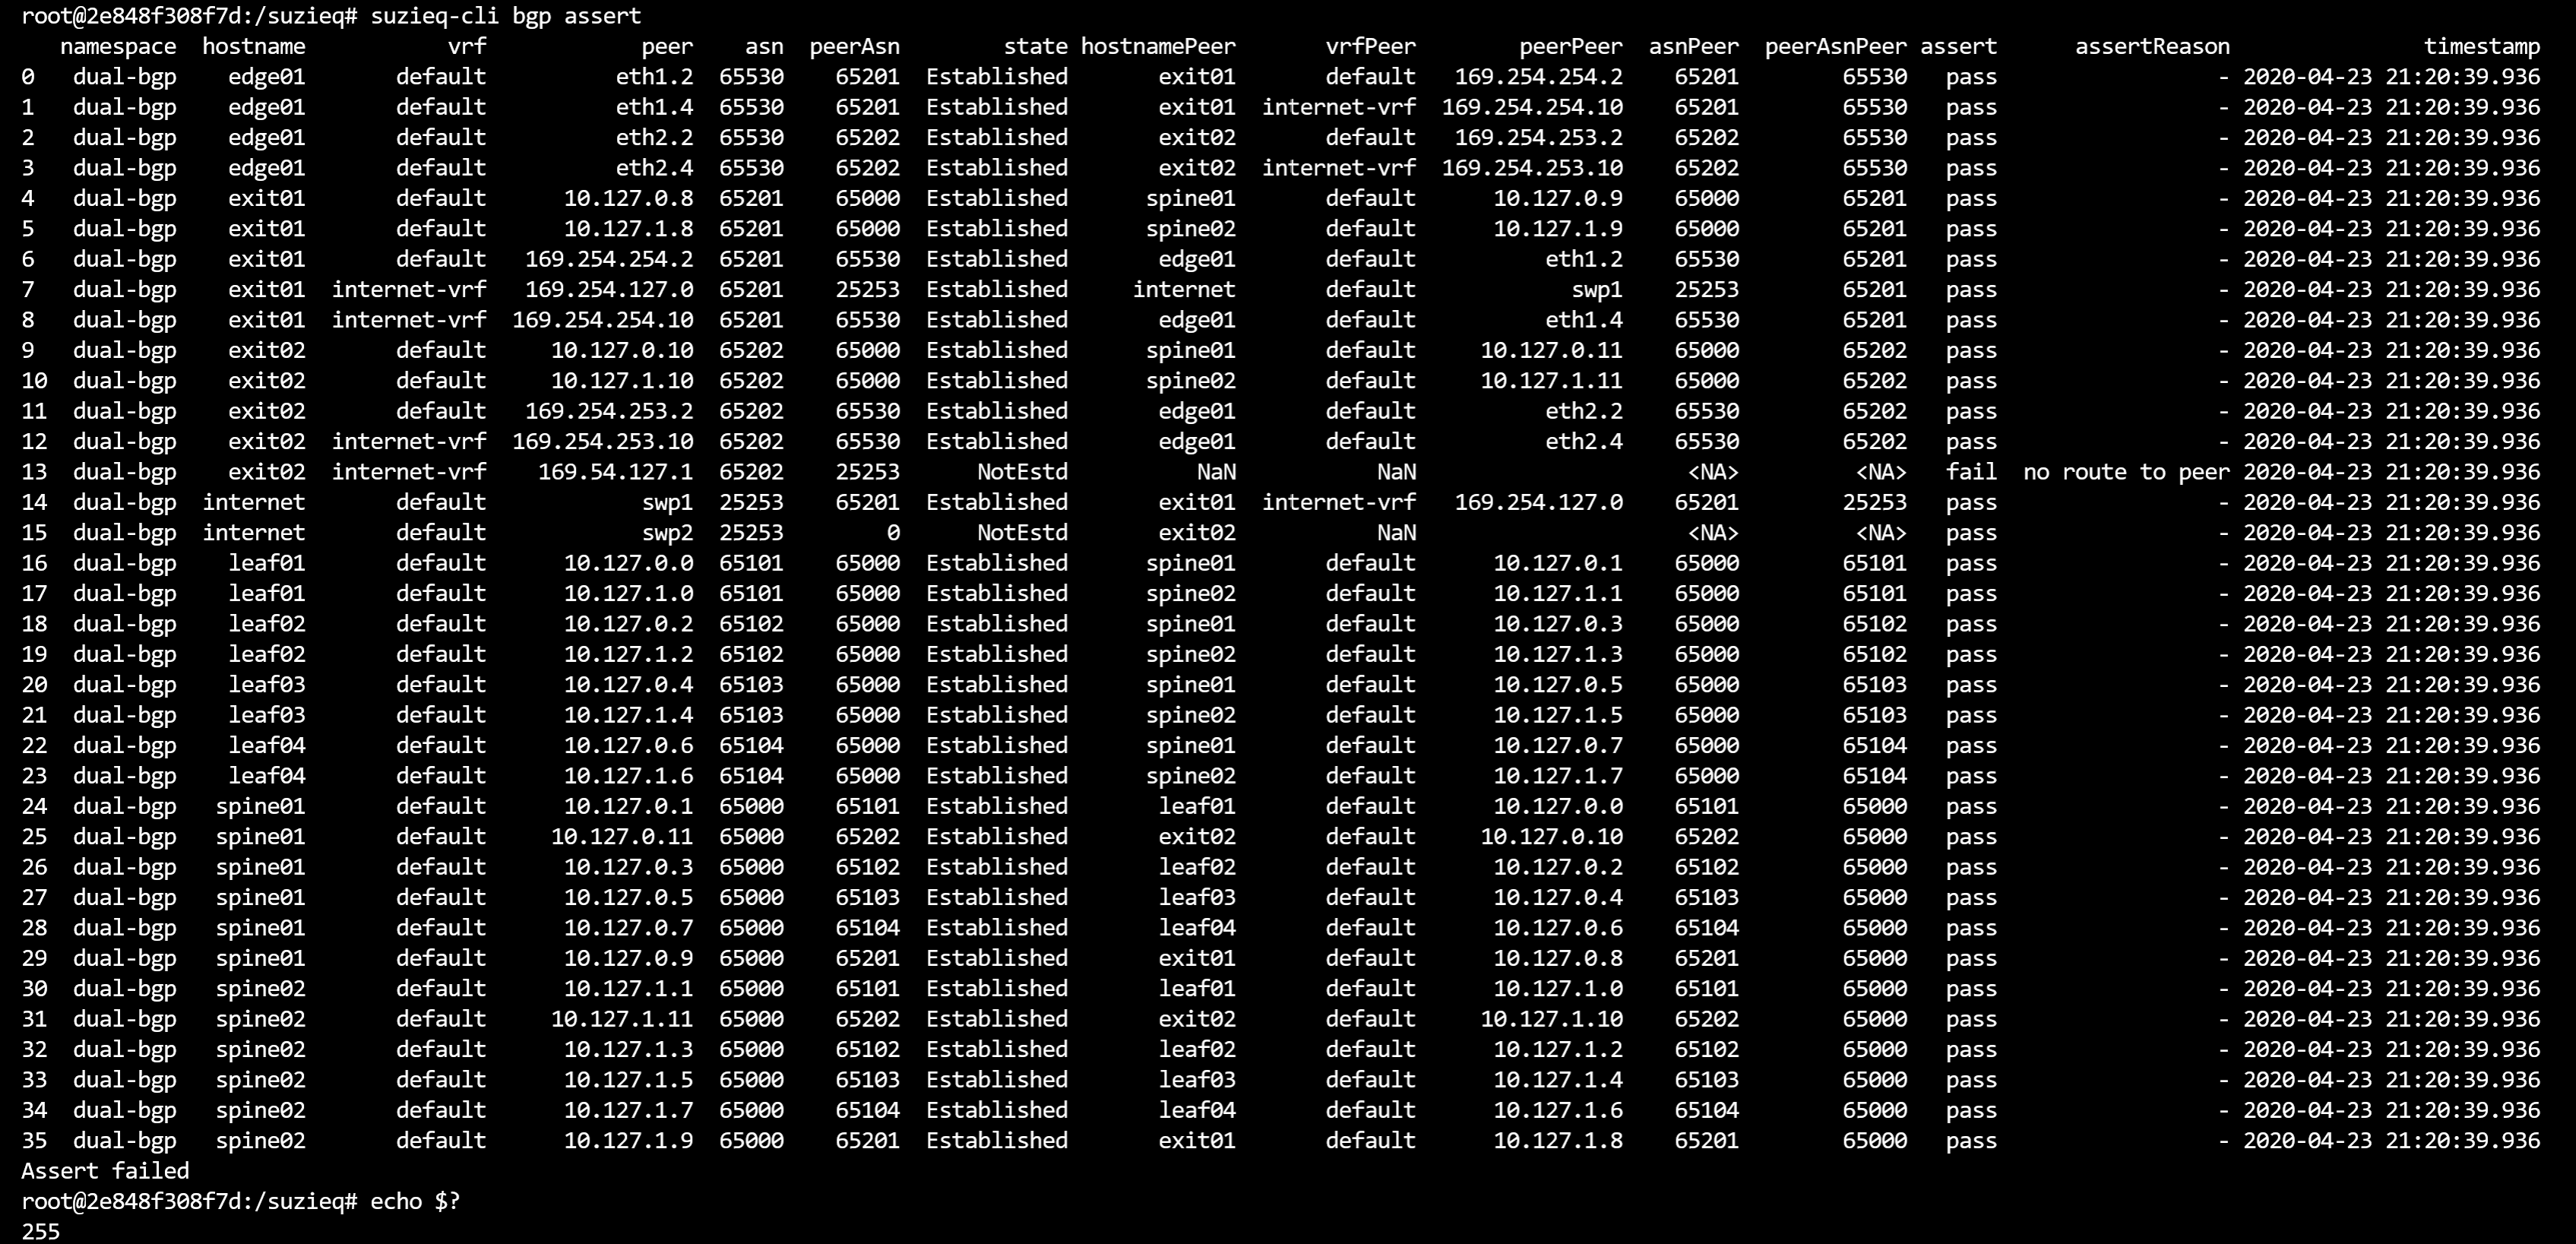
Asserts are a very important part of Suzieq and we have some interesting ones defined, but a lot more to add in the future. This shows our 'bgp assert'. This runs several different checks on the bgp data and shows which ones failed.
bgp assert
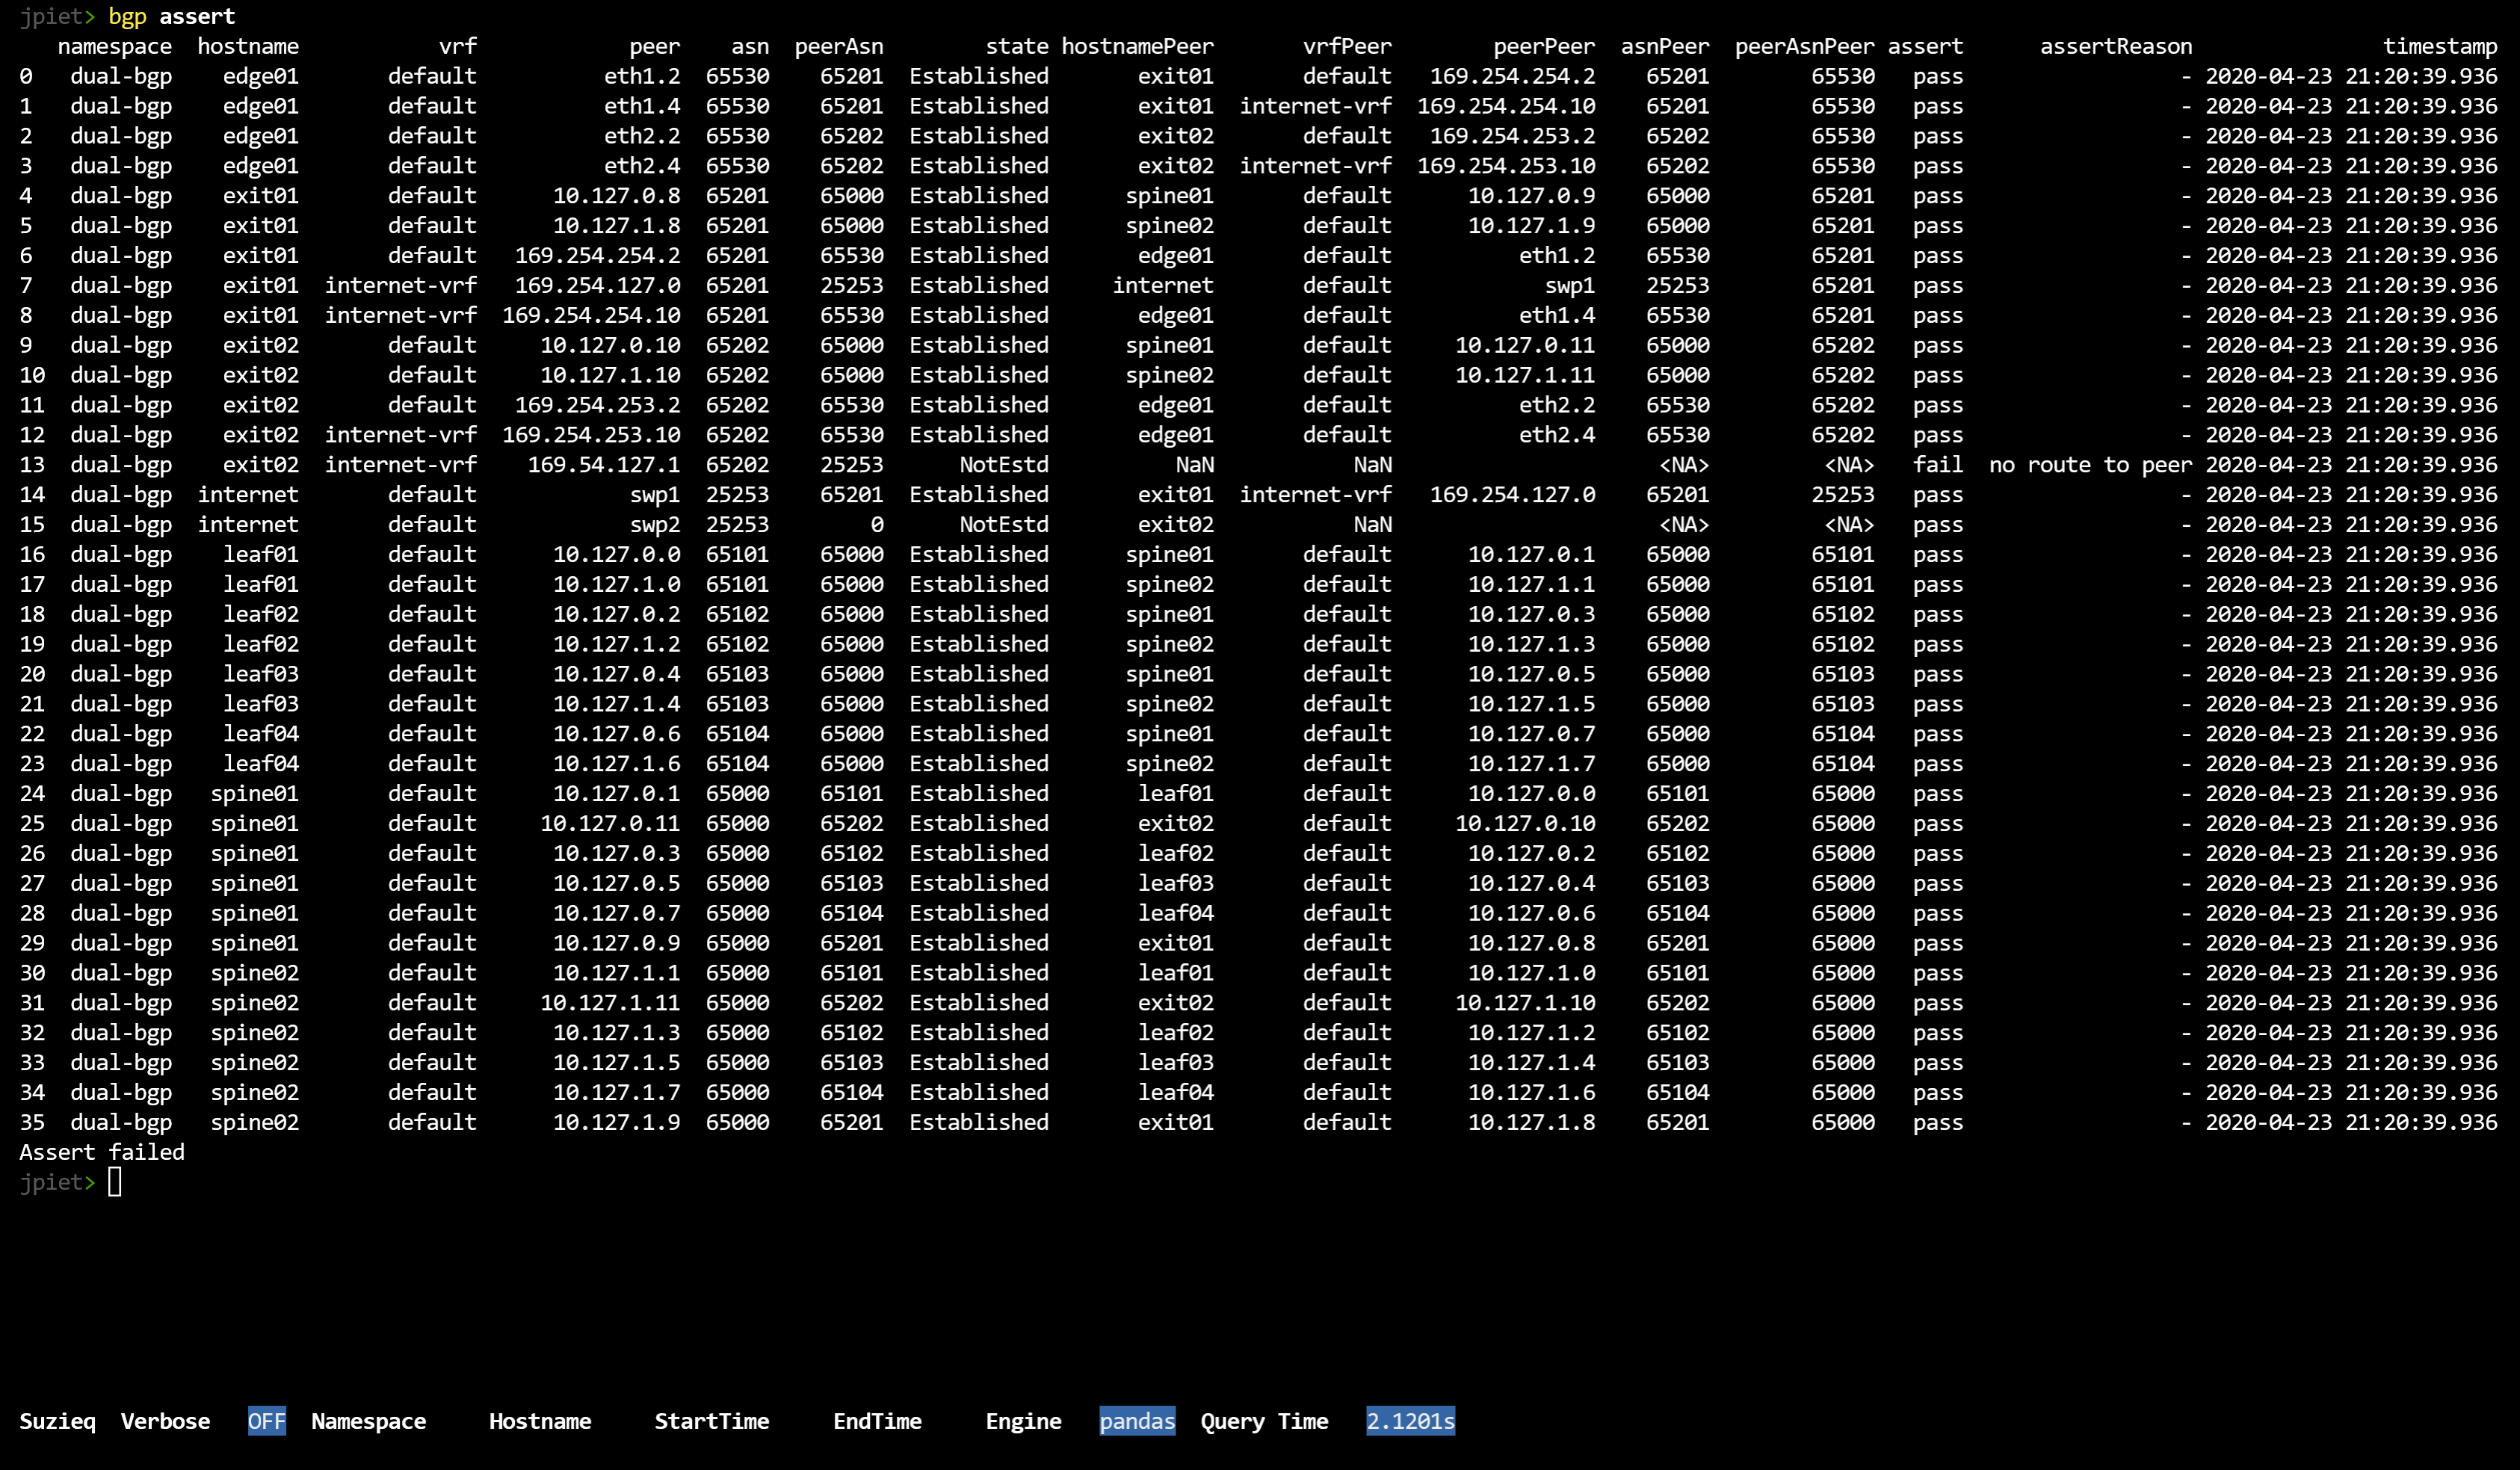 You might notice that there is a row entry per device and peer. There is then a lot of information
that is needed to run the checks in the assert. Finally, at the end there is an assert column with
pass or fail for each row, and if there is a fail, there is a list of reasons that the row failed. At the
very end is a message if the Assert passed or Assert failed.
You might notice that there is a row entry per device and peer. There is then a lot of information
that is needed to run the checks in the assert. Finally, at the end there is an assert column with
pass or fail for each row, and if there is a fail, there is a list of reasons that the row failed. At the
very end is a message if the Assert passed or Assert failed.
1.2. Path Demo
One of the nice things that we can do with Suzieq is show all the different paths between two endpoints.
path show src='172.16.1.101' dest='172.16.4.104' namespace=dual-bgp
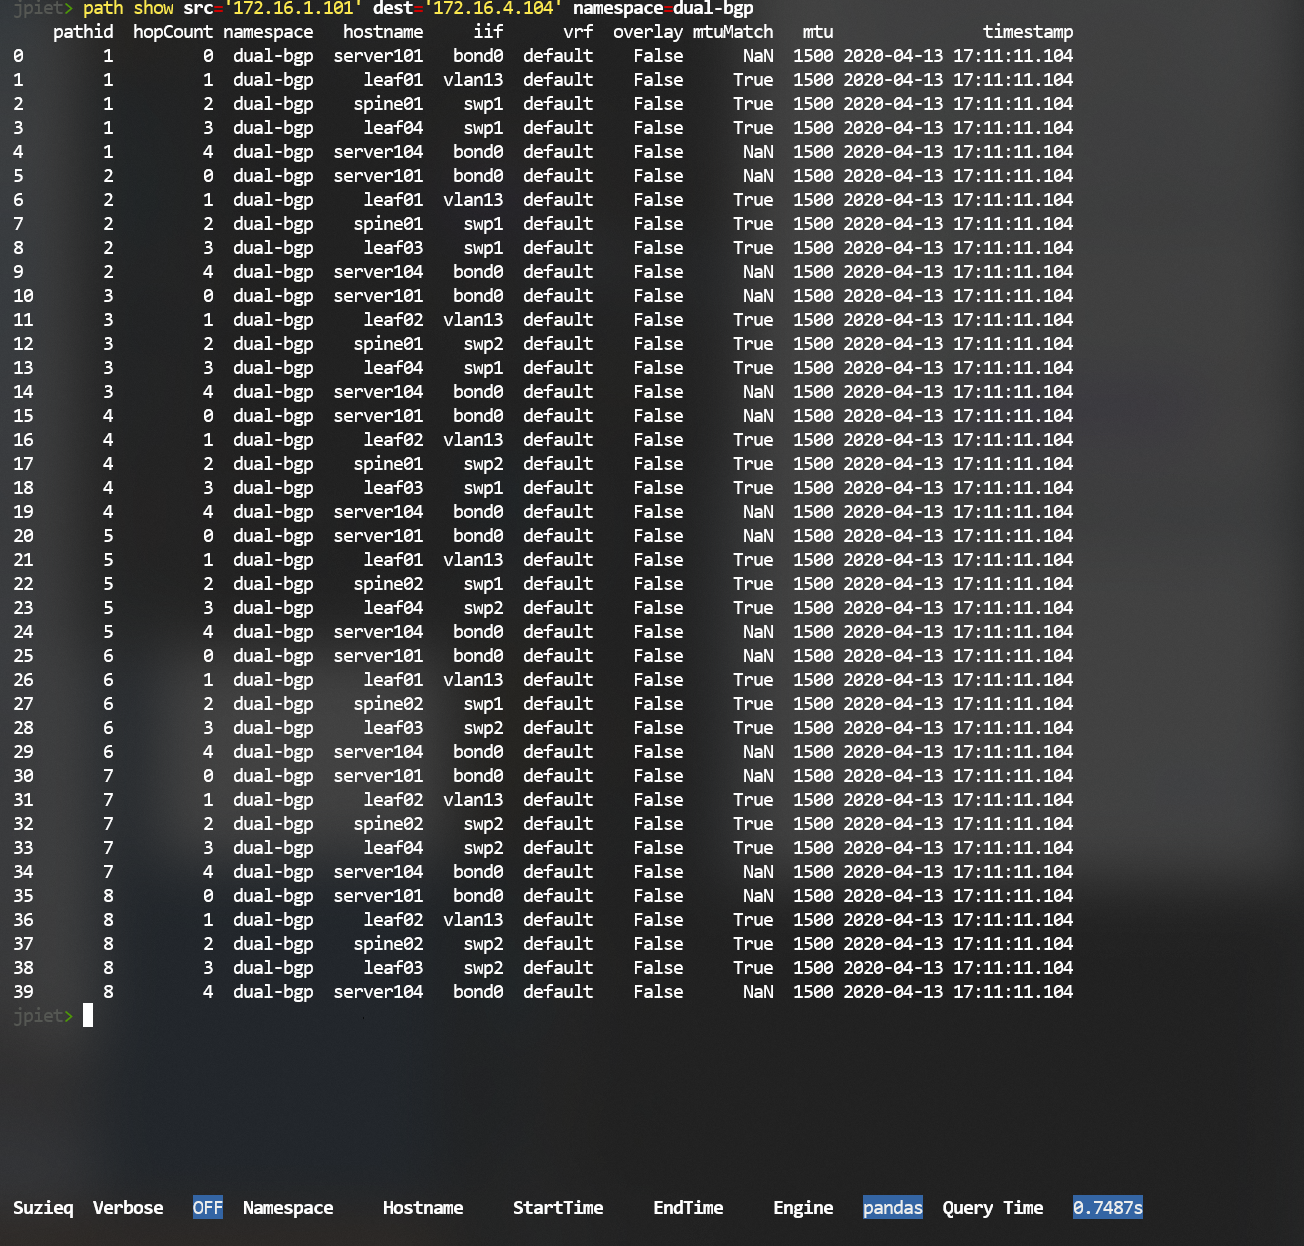 This is a little tricky
to understand. In this example, there are eight different paths, represented
by their pathid. For each pathid, we then show each hop. As you can see,
we also show the mtu, and if it is an overlay.
This is a little tricky
to understand. In this example, there are eight different paths, represented
by their pathid. For each pathid, we then show each hop. As you can see,
we also show the mtu, and if it is an overlay.
Path does not yet work in all cases, but it works in most that we know of. Some EVPN cases do not work yet; underlays + overlays are tricky.
One quirk of the libraries that Suzieq uses is that IP addresses must be put in quotes or they won't work.
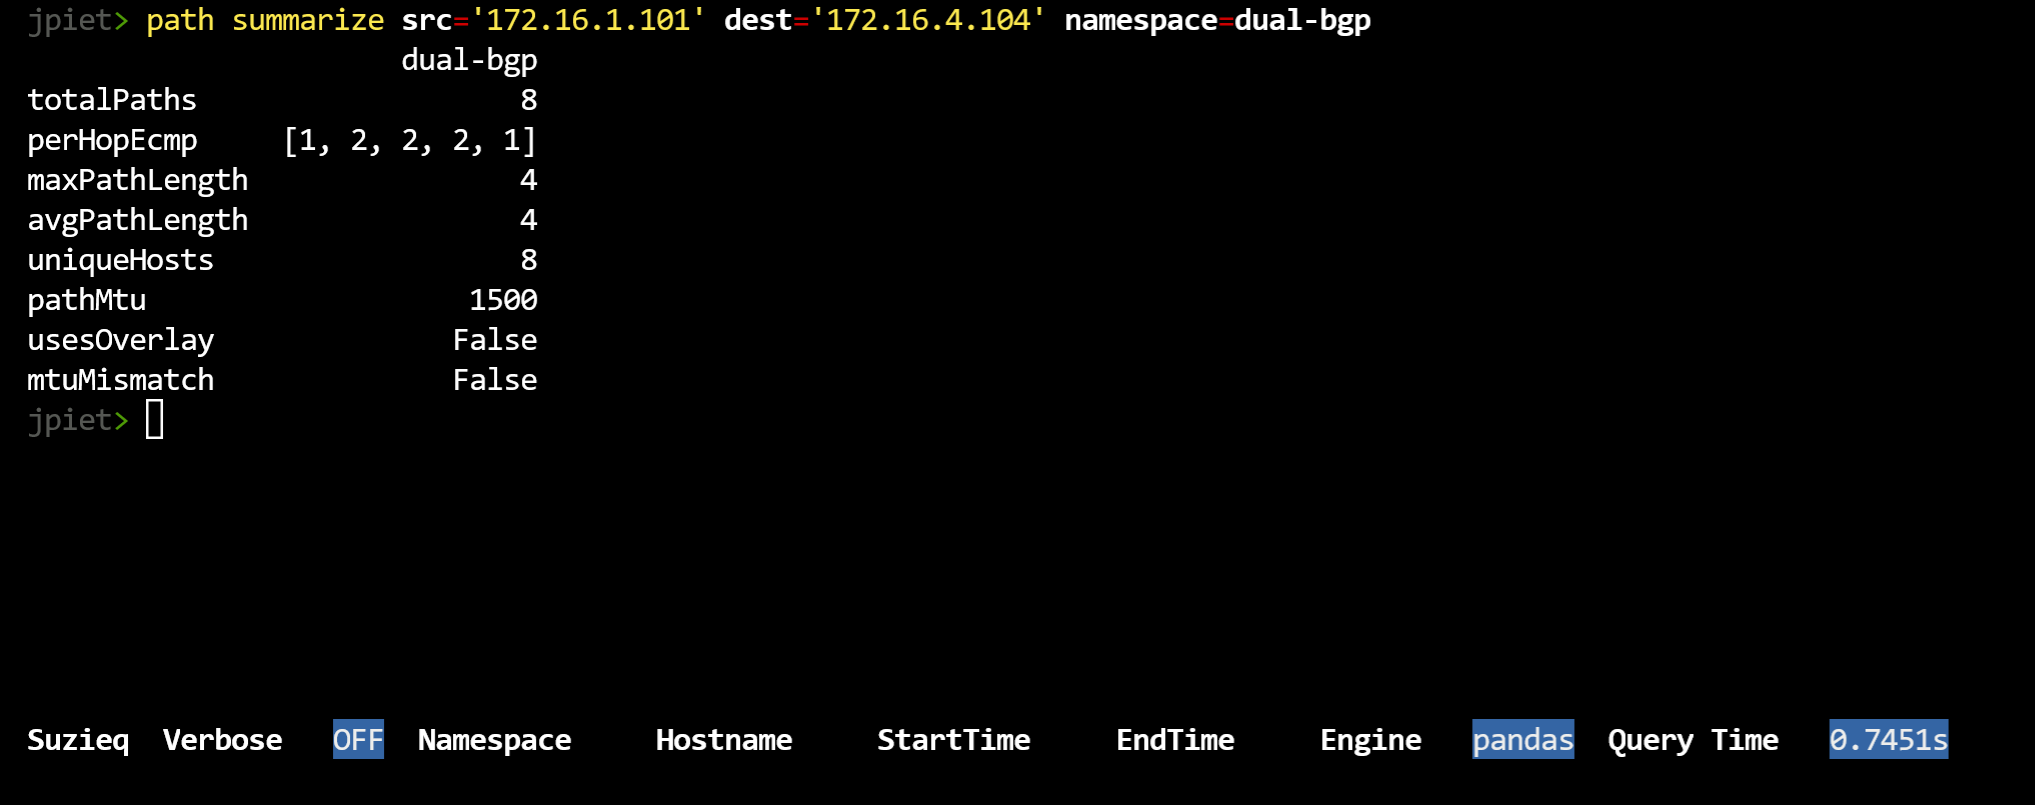
You can also get a summary of the path between two IP addresses:
path summarize src='172.16.1.101' dest='172.16.4.104' namespace=dual-bgp
1.3. Route Demo
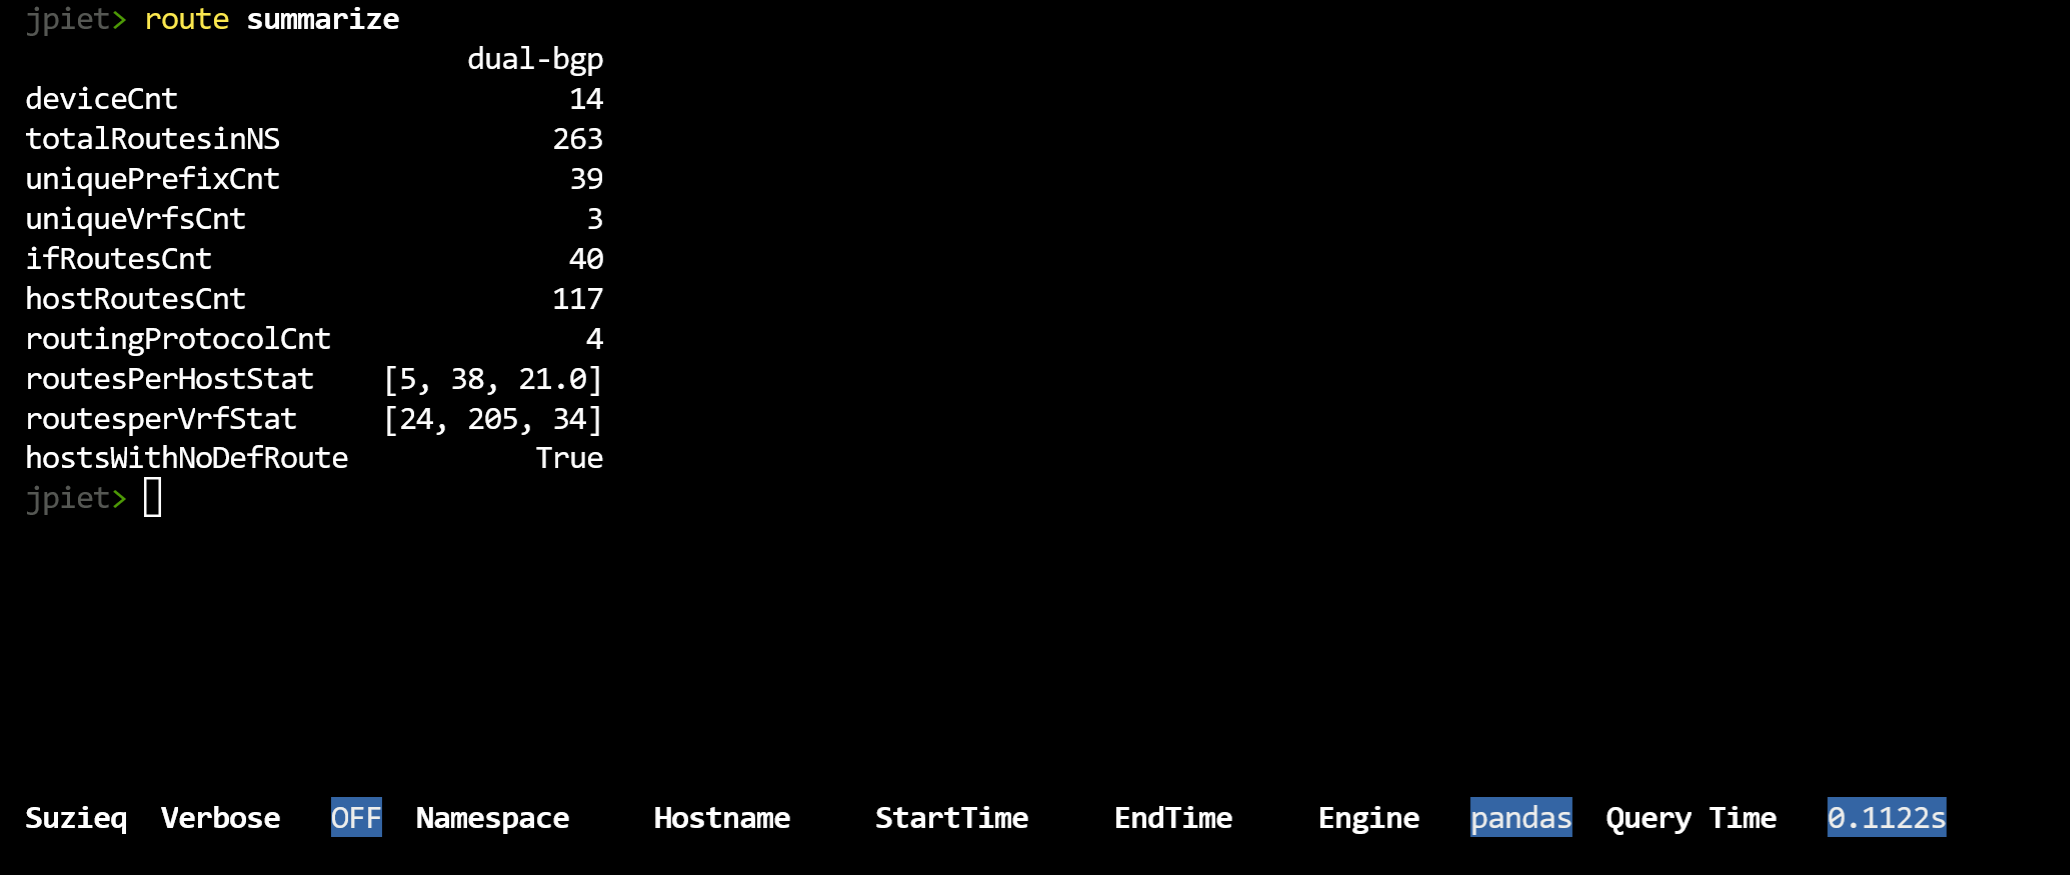
A quick peak at routes shows that there are 239 routes throughout the network.
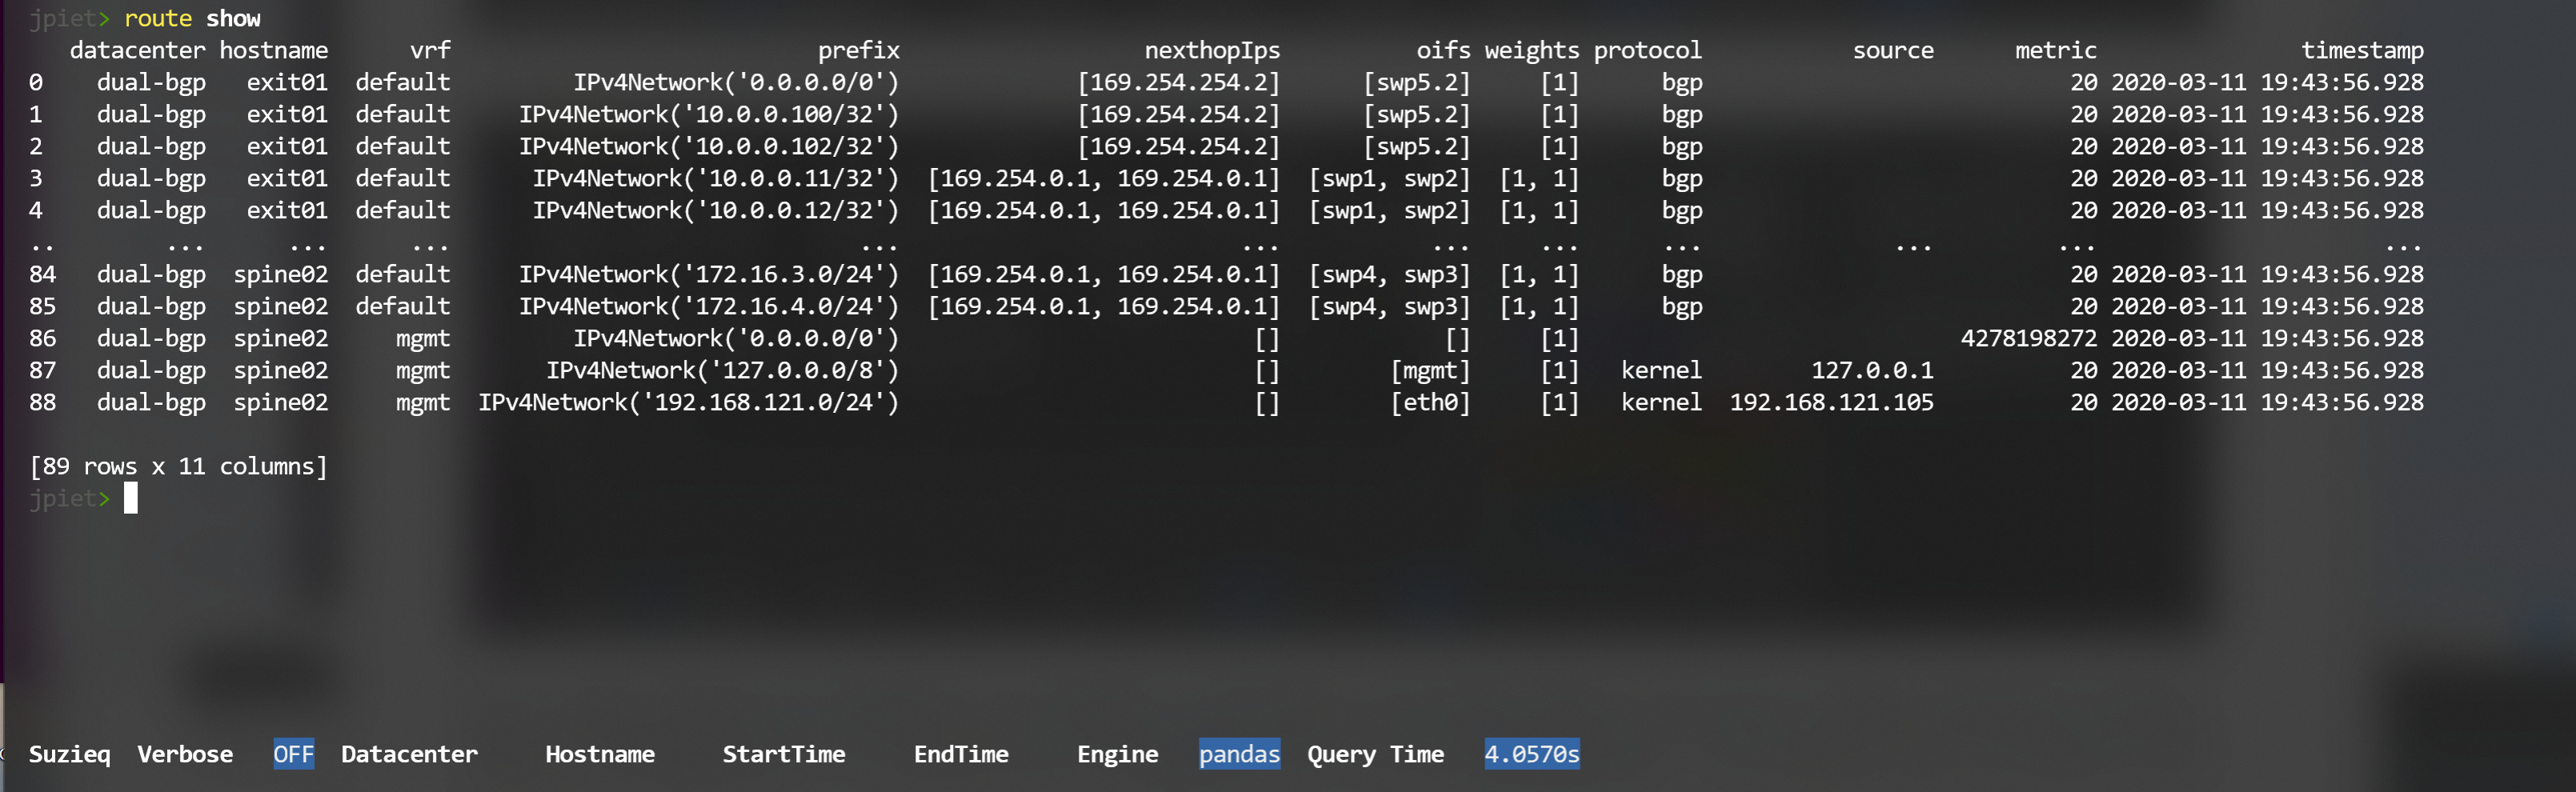
We'd like to see the number of routes per device. That and other things can be understood
from the summarize command. We can see that there are only 39 unique routes in the network.
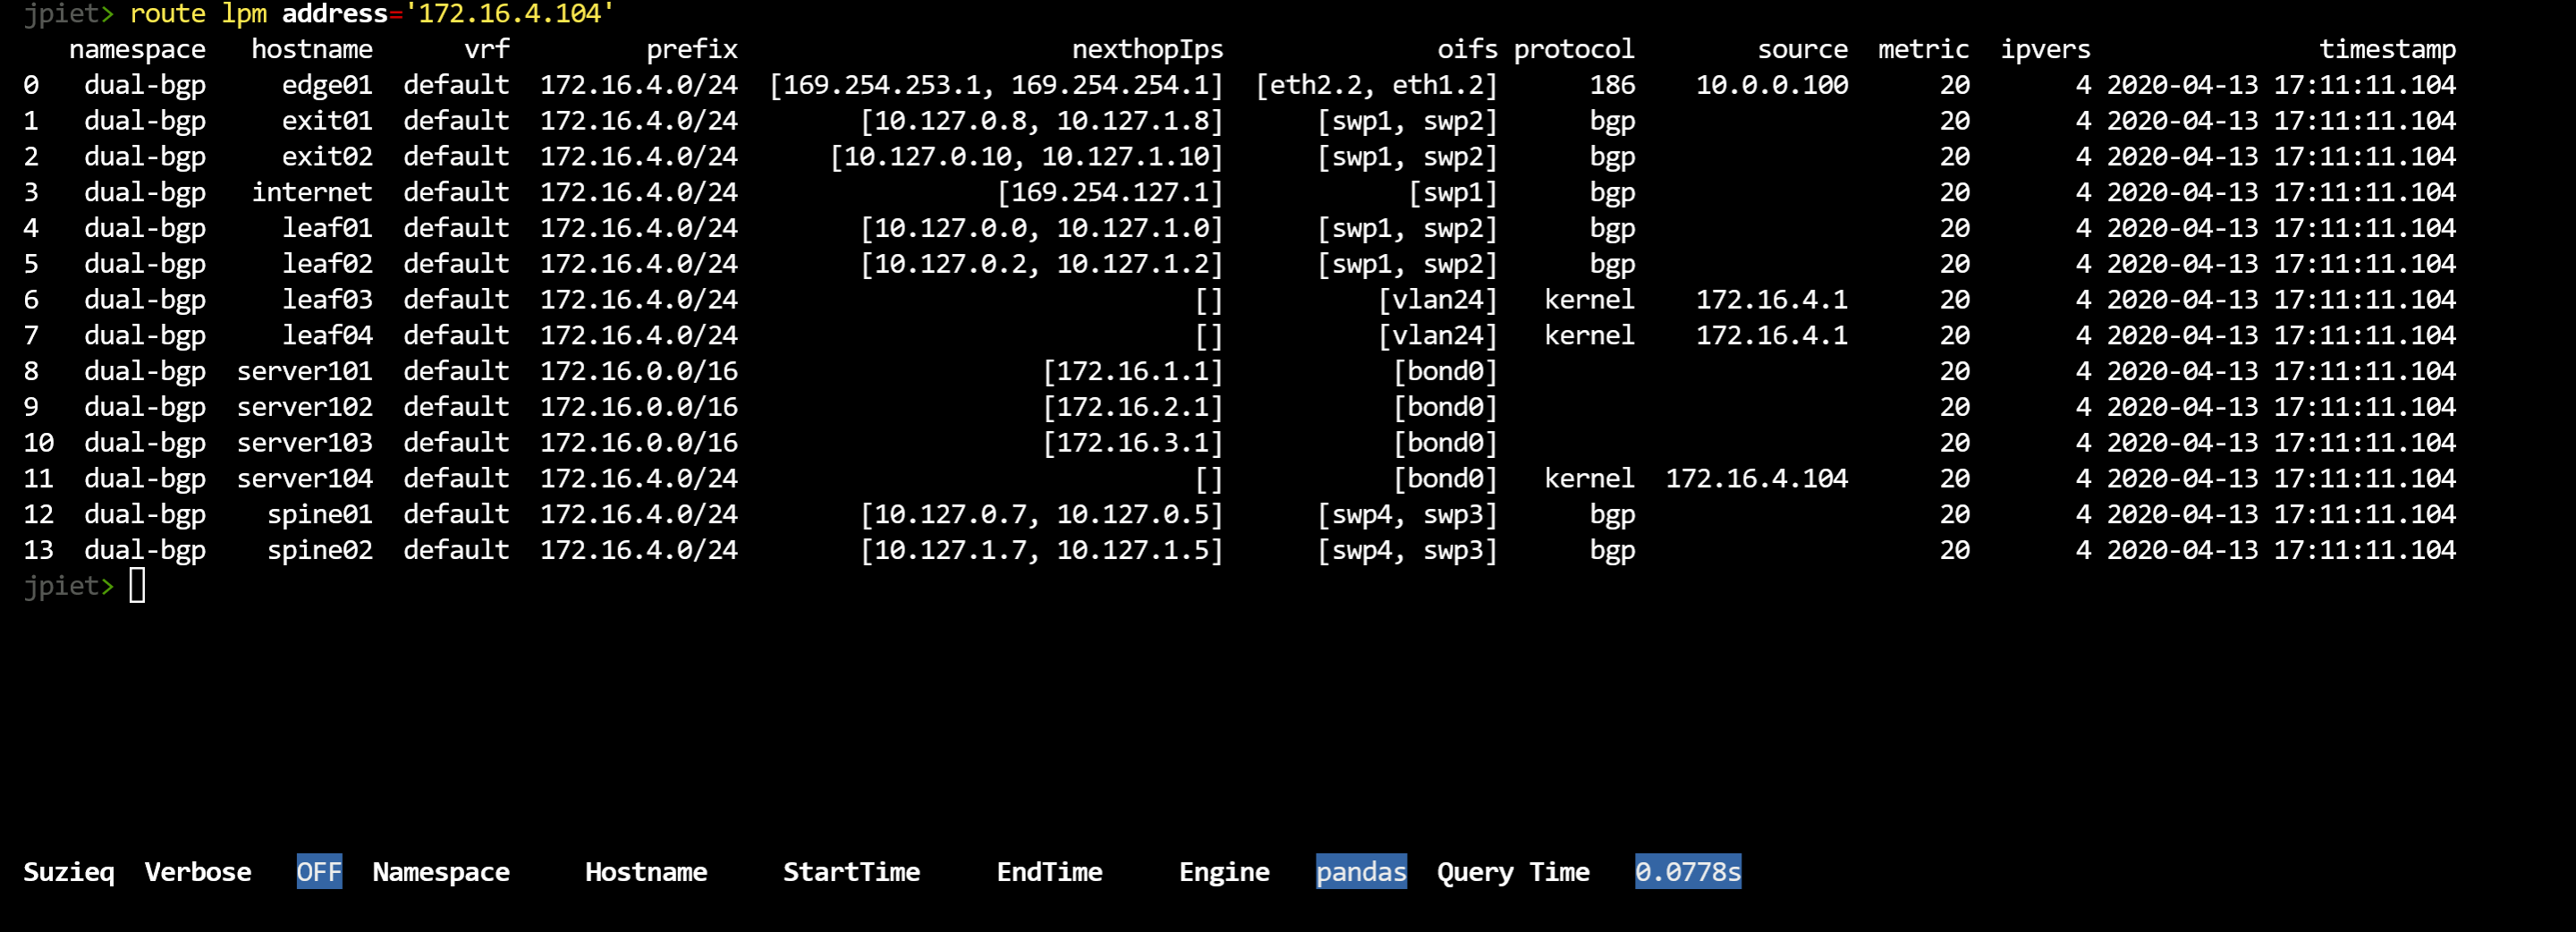
1.4. LPM Demo
Another nice attribute of Suzieq is that you can do an LPM match and see the results from each device.
1.5. Investigate Suzieq Tables
If you want to look at the database more directly, use the 'table' command. There isn't always a single connection between tables in the database and commands that are available. Also, we are collecting data in some tables, such as 'ifCounters', that do not yet have commands. We assume it's better to start getting data and then we can add useful analysis as we go along.
To see each table in the database and some statistics about each one:
table show
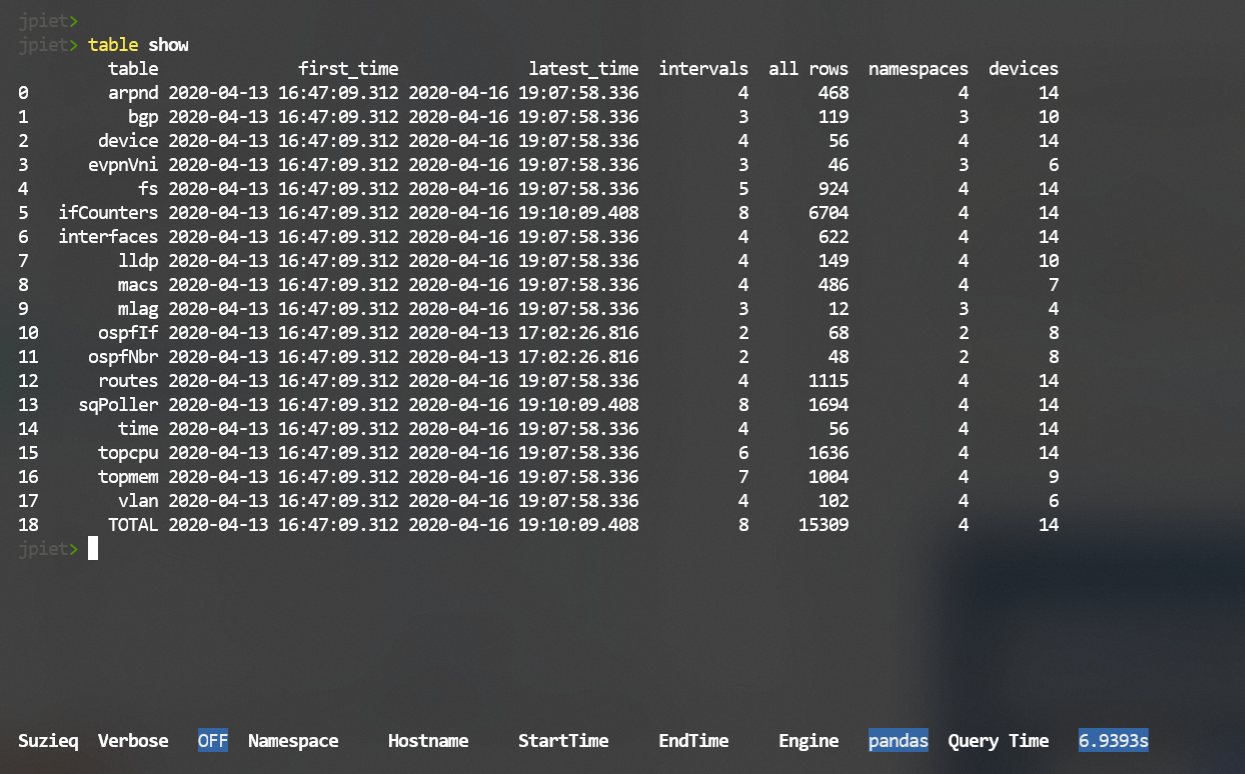 Suzieq only saves data to the database if there have been changes to the data. So some
tables will iterate often, and some will not.
Suzieq only saves data to the database if there have been changes to the data. So some
tables will iterate often, and some will not.
A special table is called 'sqPoller', and we have access to that through the CLI. It records the work that Suzieq poller is doing. At this point it's probably only useful for developers.
For each table, you can look at what is in the data and what are the columns that are displayed automatically. For instance, with BGP we collect a lot more data than we show by default.
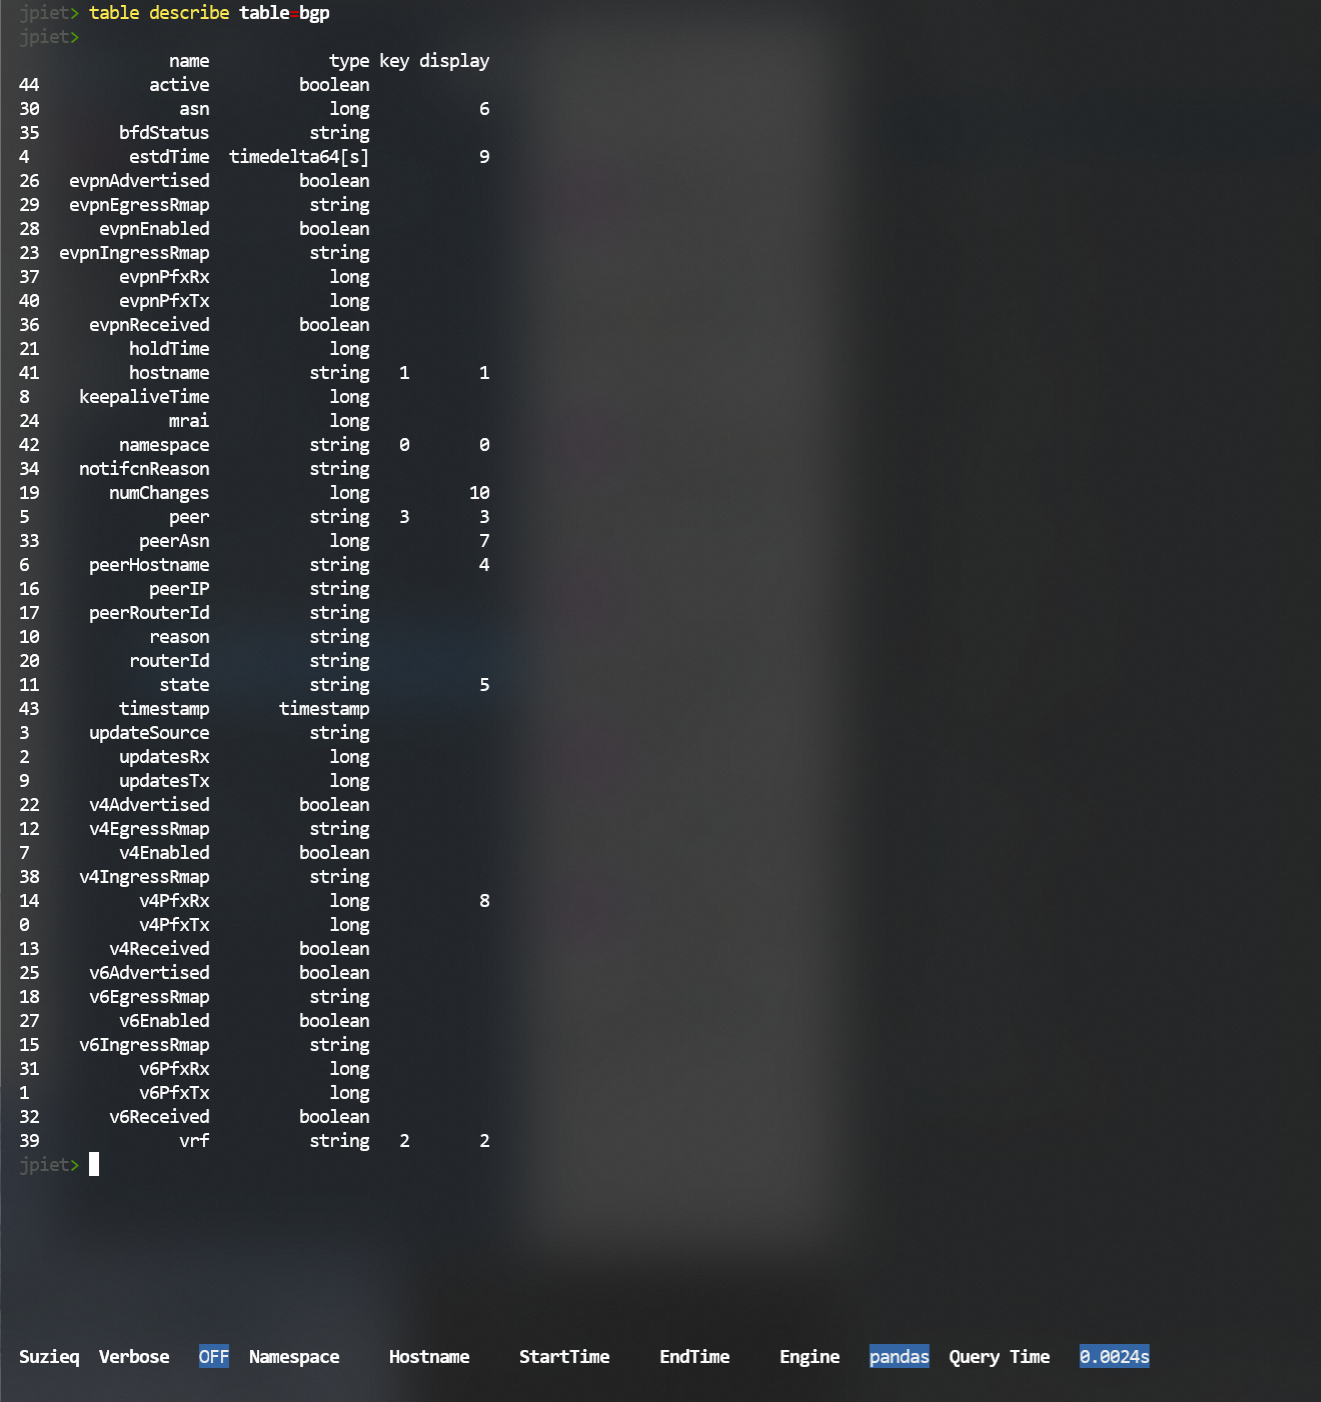 You can always display more columns by adding the columns filter at the end of a show command.
You can use 'columns=*' to get all the columns available for a command, but for bgp that is a lot!
You can always display more columns by adding the columns filter at the end of a show command.
You can use 'columns=*' to get all the columns available for a command, but for bgp that is a lot!
1.6. Using Suzieq on the command line
You can directly call a Suzieq command such as bgp summarize directly from the CLI,
and check the output of the command.
Based on the command you run, Suzieq will exit with interesting results.
For instance, if you run an assert and it fails, you will get an exit code other than 0 (usually 255.)
1.7. Filtering
As shown above, the Suzieq cli works by commands (also called services), verbs, and filters. Some of the filters we've seen so far are 'columns' and 'namespace'. Different commands and verbs have different filters.
The standard filters that work on most command/verb pairs are:
* hostname
* start-time
* end-time
* view
* namespace
* format
* columns
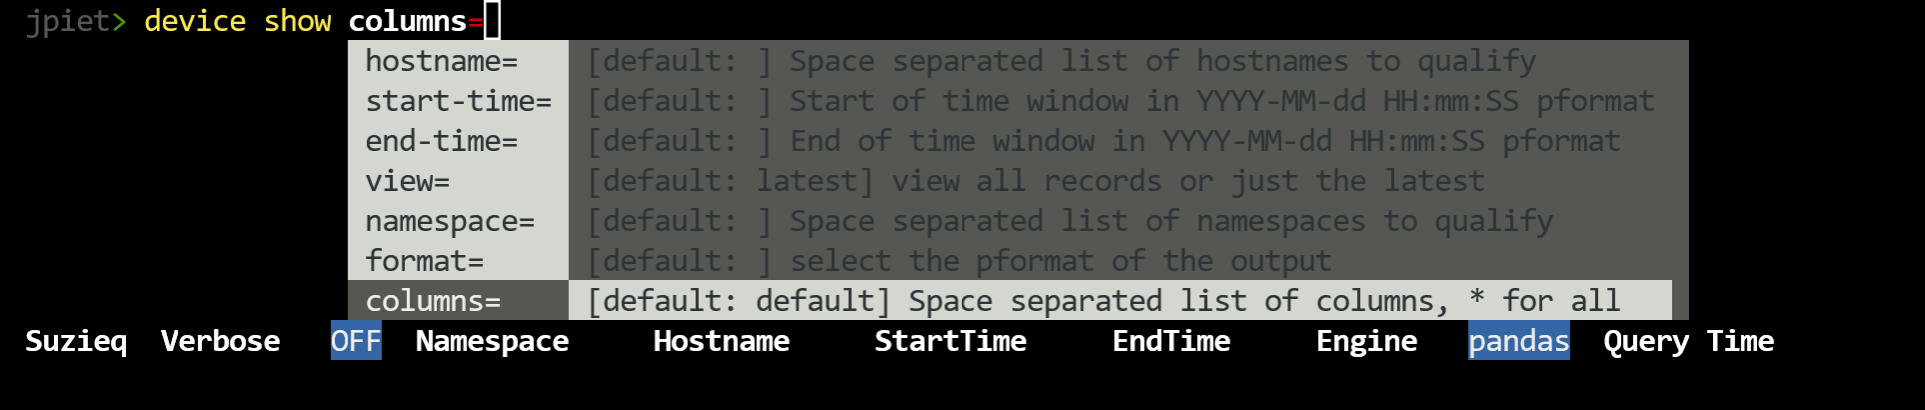
Most of those are self-explanatory. The default for view is 'latest', which means the most current change. 'view=all' will provide the data across all time. 'view=changes' analyzes just the data that has changed.
'format=' allows you to produce data other than in a pandas dataframe. This is most useful at the command line to then read in the data from suzieq.
1.8. Context Filtering
In the CLI you can set a specific context for filtering all the commands that you use. For instance, if you want to set a filter for the namespace that you will be investigating then you type
set namespace=dual-bgp
you can add or remove context filters as necessary.
1.9. How time works in Suzieq
By default when you use the CLI and you use a command, you will be using 'view=latest'. This is usually the most useful and what you expect to see. If you want to see all your data, add 'view=all'. You can also select specific start and end times that you are interested in.
Suzieq also has the notion of seeing changes during a time window. If you specify a start-time and and end-time and don't specify 'view=all', then you will see only the changes during a time window.
2.2. Installation with Pipenv
The complicated non-docker way to install Suzieq is to get the code from GitHub:
1. git clone: git clone git@github.com:netenglabs/suzieq.git
2. Suzieq assumes the use of python3.7 which may not be installed on your computer by default.
Ubuntu 18.04 ships with 3.6 as default, for example. Check your python version with python3 --version.
If that is different from 3.7, you’ll need to add the python3.7 and 3.7 dev package.
But, until we can build the different engines separately, we’re stuck with this requirement.
3. To install python3.7 on Ubuntu 18.04, please execute the following commands:
sudo add-apt-repository ppa:deadsnakes/ppa
    sudo apt install python3.7 python3.7-dev
4. Install python3-pip if it has not been installed.
sudo apt install python3-pip
5. From the suzieq directory, run pip3 on the requirements file:
bash
   pip3 install --user --disable-pip-version-check -r /requirements.txt
Suzieq requires that you have a suzieq config file either in '/.suzieq/suzieq-cfg.yml' or '/.suzieq-cfg.yml'. It looks like:
data-directory: /home/jpiet/parquet-out
service-directory: /home/jpiet/suzieq/config
schema-directory: /home/jpiet/suzieq/config/schema
temp-directory: /tmp/suzieq
logging-level: WARNING
python3 suzieq/poller/sq-poller.py -D ~/dual-bgp
2 Asserts
As demonstrated above in the README, Suzieq has a powerful concept called Asserts. In an assert for a service some number of checks are made to ensure that the network is setup correctly. For each service that has an assert you get an output that shows all the data necessary for the checks, a pass/fail column, and a reason column for any failed checks.
Also, as mentioned before, if you run an assert from your shell and check the return code, a failure of the assert will be a non-zero value, usually 255.
2.1. BGP Assert
As shown above in the README
The checks that are run in the BGP assert are: * outgoing link down * no route to peer * asn mismatch * not established -- it gets the error that the device reported in the notifcnReason
2.2. EvpnVni Assert
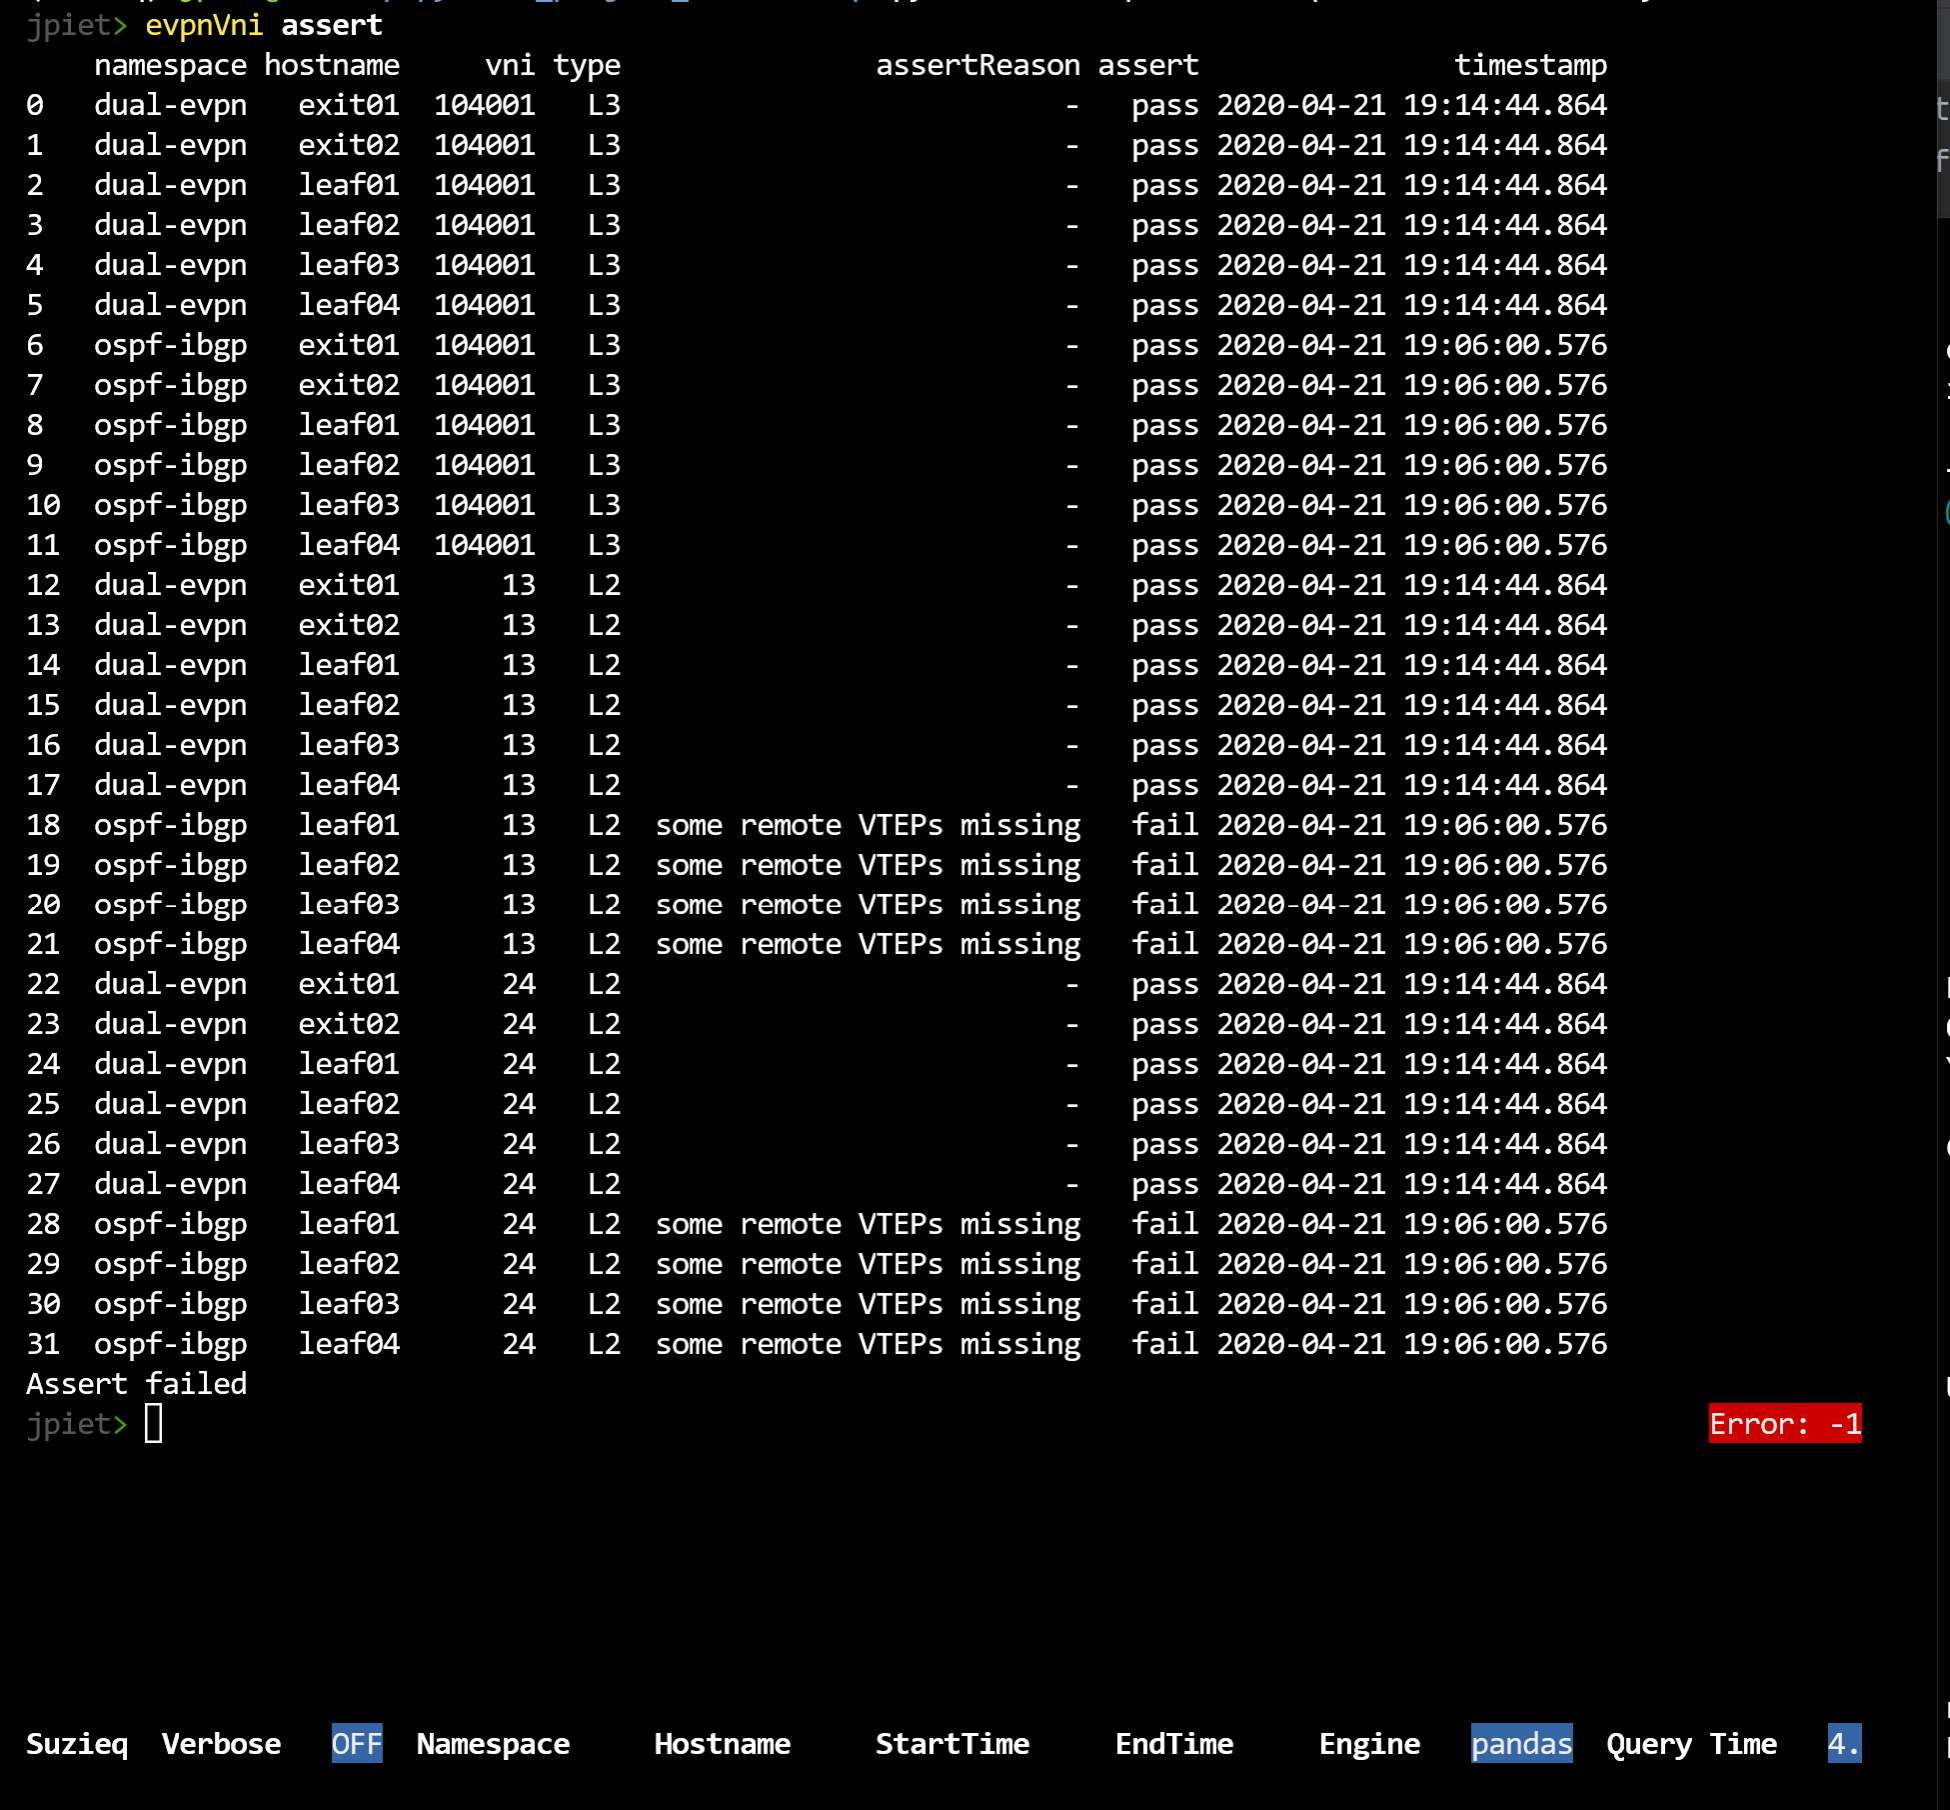
The checks in EvpnVni Assert are: * interface is down * some remote VTEPs missing * a VTEP is not reachable * a VTEP is reachable via default * HER is missing VTEPs
2.3. Interface Assert
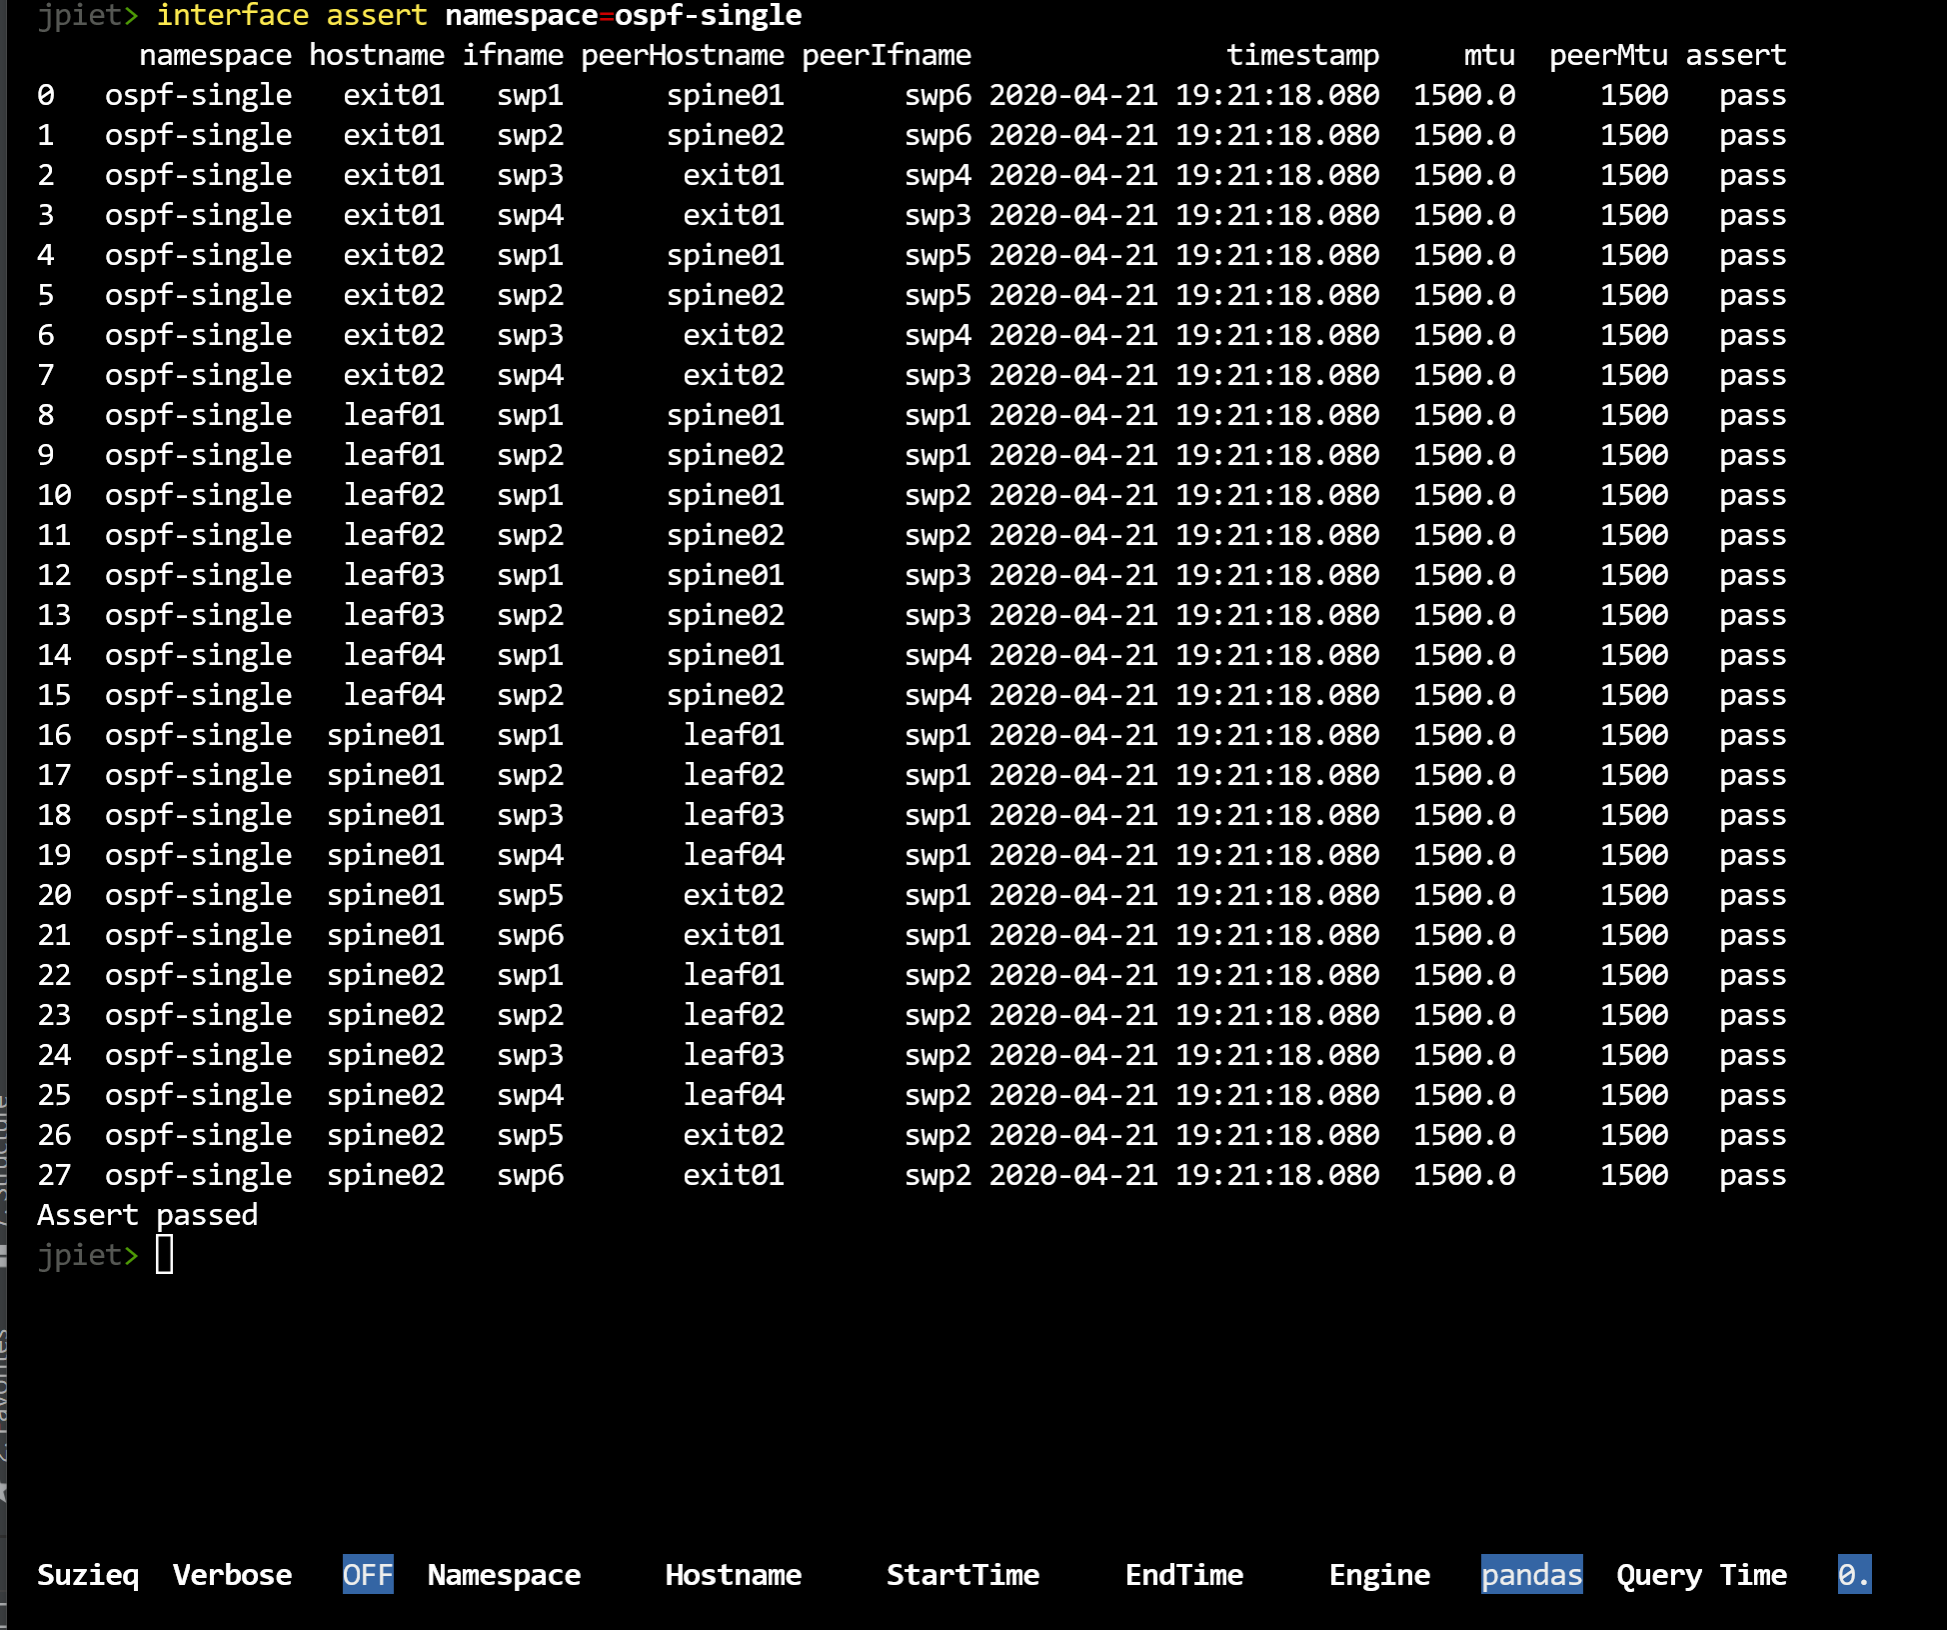
The checks in Interface Assert are: * mtu match on both sides of a connection
2.4. OSPF Assert
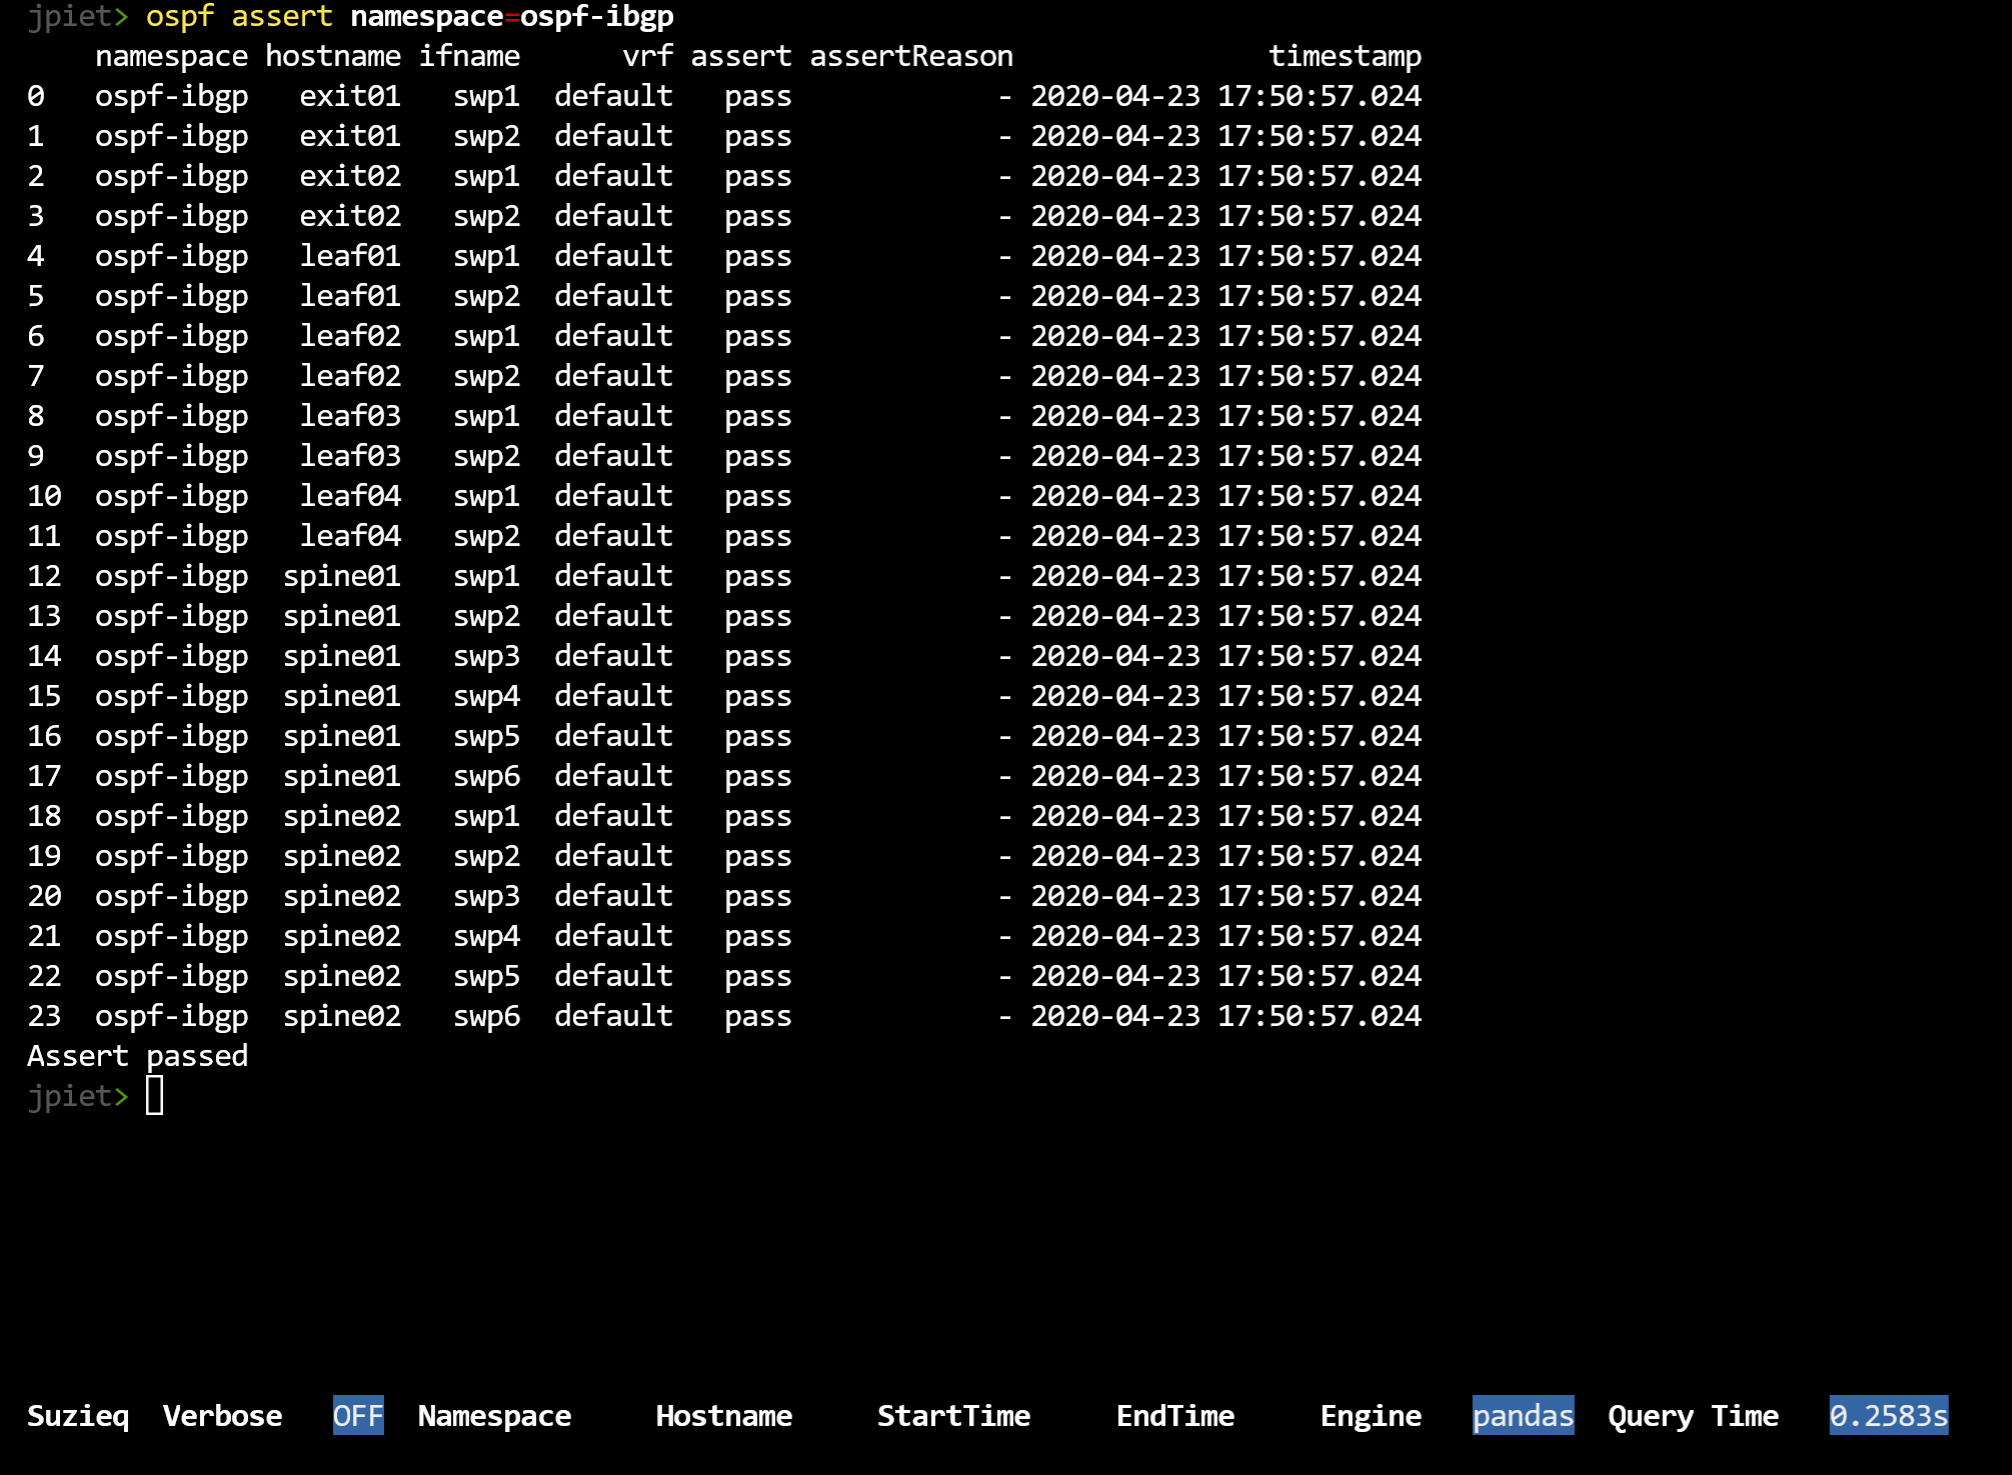
The checks in OSPF Assert are: * duplicate routerId * subnet mismatch * area mismatch * Hello timers mismatch * Dead timer mismatch * network type mismatch * passive config mismatch * vrf mismatch